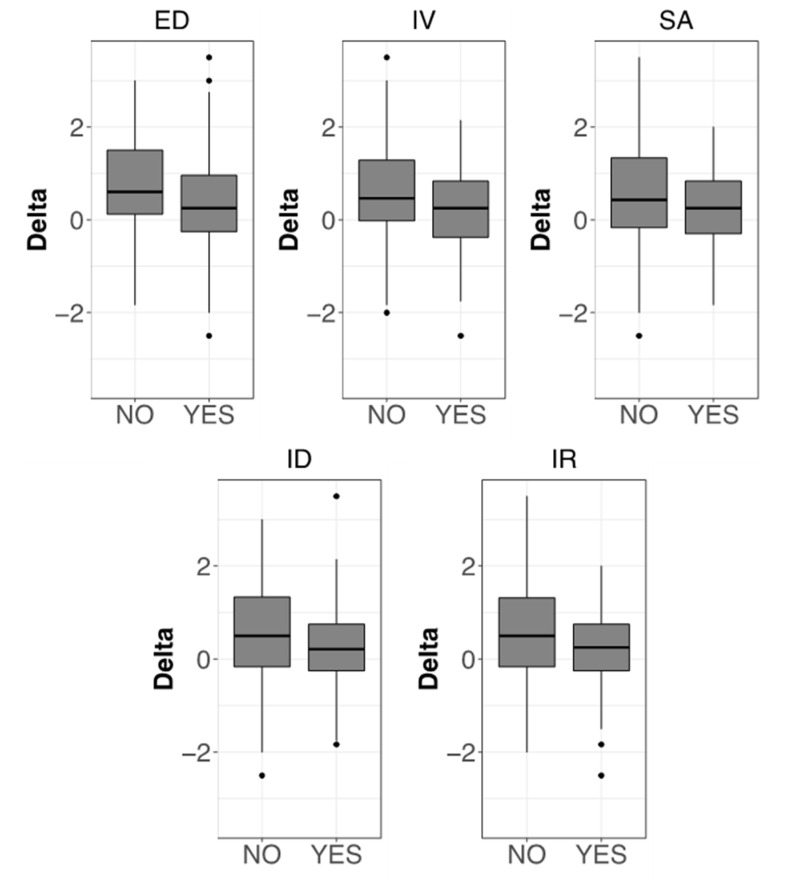
Figure 9.
Boxplots showing the correlation between therapy effectiveness and different CBA-H test categories. For each category of the CBA-H test, two groups have been identified based on the cutoff for the presence of the related clinical concern (see Figure 6). Delta values (vertical axis) represent differences between the average efficacies of non-pharmacological and pharmacological therapies. Positive values indicate the prevalence of non-pharmacological treatments. Only the categories with significant differences between NO and YES cases are shown (Mann–Whitney test, p < 0.05). CBA-H part B (left top): ED = Depressive mood. CBA-H part C: IV = Introversion; SA = Social anxiety; ID = Interpersonal difficulties; IR = Inability to relax.

