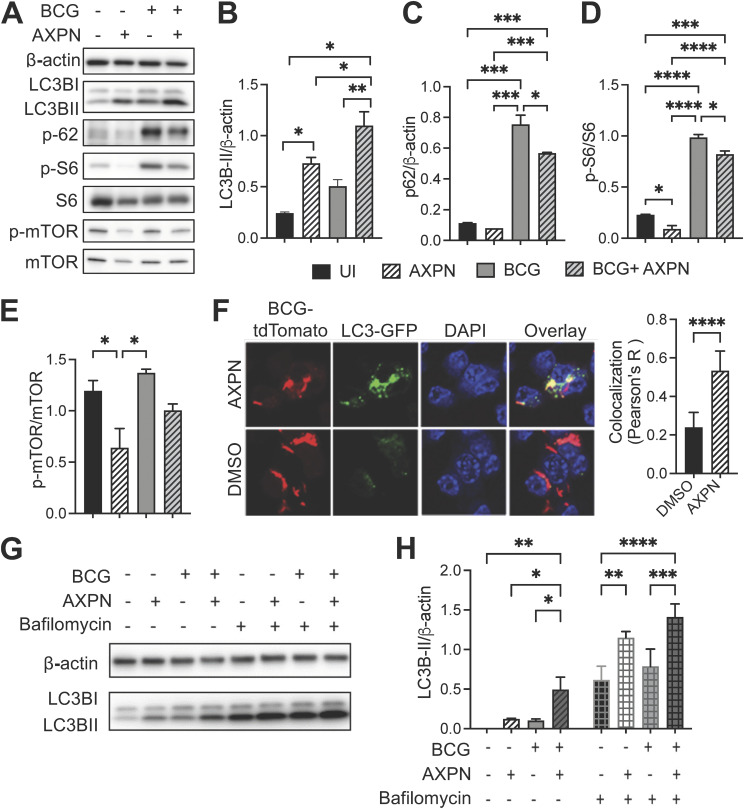
FIG 2.
Amoxapine induces autophagy in an mTOR-dependent manner. (A) RAW264.7 cells were infected with BCG at an MOI of 10 for 3 h and then treated with 10 μM Amoxapine for 24 h, and Western blots were used to determine LC3B-II, p62, phosphor S6 (S235/236), total S6, phosphor mTOR (S2448), total mTOR, and actin levels. (B to E) Quantifying protein levels are shown in panel A using Image J. (F) RAW 264.7 LC3-GFP cells were infected with BCG-tdTomato at an MOI of 10 for 3 h and then treated with 10 μM Amoxapine for 24 h. Cells were fixed and stained with DAPI (4′,6-diamidino-2-phenylindole). Confocal images were acquired using an A1 Nikon confocal microscope with a 60× objective, and Pearson’s correlation was used to quantify colocalization between LC3-GFP and BCG-tdTomato. (G to H) Representative Western blots of LC3B-II in RAW 264.7 cells with BCG infection and 10 μM Amoxapine treatment at 24 h postinfection. Bafilomycin A was added to the cells at a concentration of 1 μM for 4 h before protein extraction. Image J was used for quantifying the LC3B-II level. Data represent means ± standard deviations for three independent experiments. One-way ANOVA with Dunnett’s multiple-comparison test or Student’s t test was used for statistical analysis. *, P < 0.05; **, P < 0.01; ****, P < 0.0001.

