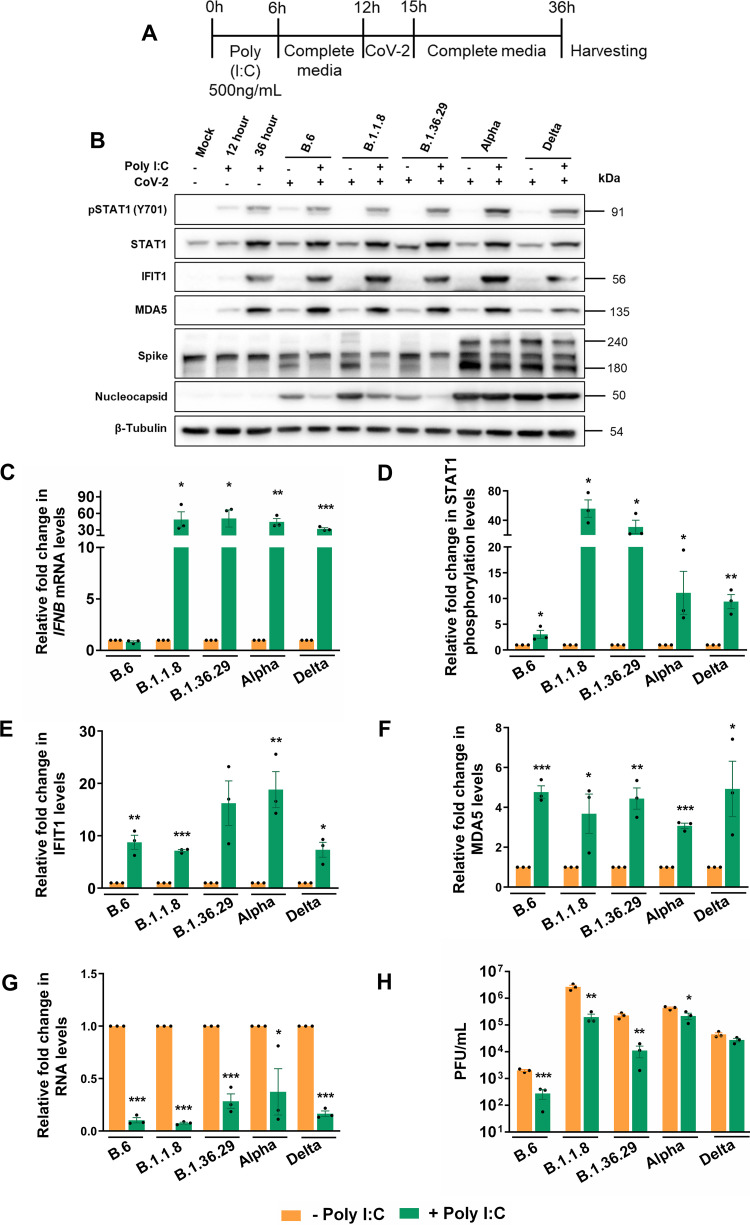
FIG 3.
Alpha and Delta are sensitive to RLR activation by poly(I·C). (A) Schematic of the experimental setup for poly(I·C) treatment prior to variant infections. Caco2 cells were transfected with 500 ng/mL poly(I·C) for 6 h, after which the transfection medium was replaced with growth medium for incubation for another 6 h. At this point, the cultures were infected with 1 MOI of individual variants with 3 h of inoculation followed by further incubation in virus-free medium for a total of 24 h infection. (B) Immunoblots of the samples prepared from the infection for analyzing JAK-STAT activation. (C) IFNB1 quantification in poly(I·C)-treated infected samples against the untreated infected samples by qRT-PCR. The values are represented as fold changes. First, fold changes from the infected samples against the mock-infected samples were generated through the ΔΔCT method by normalizing against the internal control GAPDH of the corresponding sample. Subsequently, fold changes of such values generated in the poly(I·C)-treated infected samples against the untreated samples were calculated and plotted in the graph. (D to F) Densitometric quantification of the STAT1 phosphorylation and expressions of IFIT1 and MDA5. (G) SARS-CoV-2 RNA levels in the supernatants of poly(I·C)-treated infected samples measured by qRT-PCR and represented as fold changes against the values from the respective untreated infected samples. First, fold changes from the infected samples against the mock-infected samples were generated through the ΔΔCT method by normalizing against the internal control RNase P of the corresponding sample. Subsequently, the fold changes of such values generated in the poly(I·C)-treated infected samples against the untreated samples were calculated and plotted in the graph. (H) Infectious titers of SARS-CoV-2 in the supernatant of poly(I·C)-treated infected samples measured by PFA. Raw values were plotted as PFU/mL for specific time intervals and individual variants. All the graphs are representatives of biological triplicates. A common color legend describing the variant identity has been provided at the bottom of the figure. All graphs were prepared using GraphPad Prism version 8.0.2. Statistical significance is represented as *, **, and *** for P < 0.05, P < 0.01, and P < 0.005, respectively.

