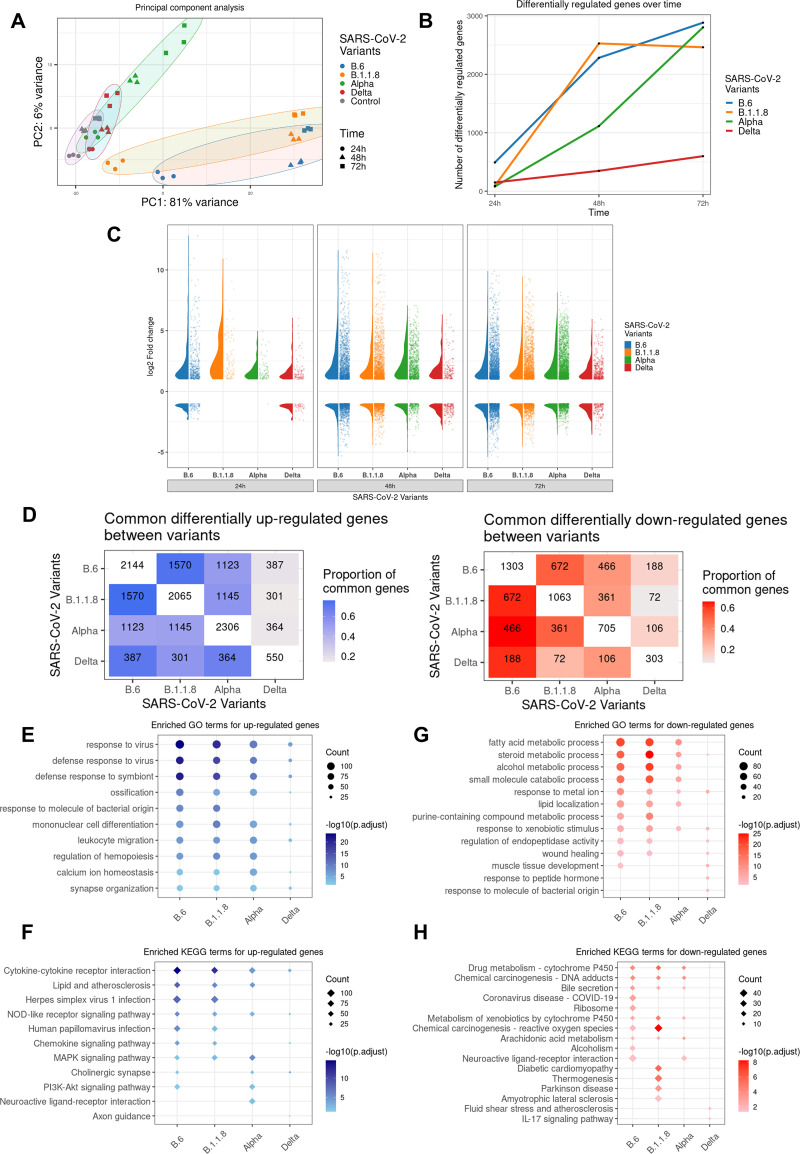
FIG 5.
Gene expression profiling in response to SARS-CoV-2 variants. Total RNA isolated from Caco2 cultures infected with distinct variants for the respective time intervals was subjected to next-generation sequencing. Three biological replicates were used for library generation and sequencing. The sequences generated were analyzed by PCA. All DEGs considered had log2 fold changes of >1 for the upregulated and <–1 for the downregulated genes, with a P adjacent value of <0.05. (A) PCA analysis of the sequences generated. Regularized log transformed count data were used for computing principal components. The PCA confirms the quality of data where biological replicates clustered together. From the control samples, maximum variance was observed for B.6 and B.1.1.8, followed by Alpha. (B) Line graphs showing the total number of differentially expressed genes in response to individual variants at the specified time points. The number represents sum of both up- and downregulated genes. (C) Violin plots representing the distribution of log2 fold changes and jitter plots representing the number of DEGs in response to different variants at each time point. (D) Heat maps representing the overlapping DEGs across time points between variant-infected samples in the x axis and y axis. The numbers in diagonal boxes represent the total number of statistically significant up- or downregulated genes in the corresponding samples. The upregulated genes are represented in blue boxes, while the downregulated ones are in red. The color intensity represents the proportion of DEGs for the variants in the y axis overlapping DEGs for the variants in the x axis. (E and F) Enrichment analysis representing the enriched GO (circles) and KEGG (diamond) terms for upregulated DEGs for each variant-infected sample across time points. The size of the dot is proportionate to the number of DEGs representing the enriched term, and the intensity of the color represents the -log10 (adjusted P value) of the DEGs represented. (G and H) Similar enrichment analysis for downregulated genes caused by infection by individual variants. The upregulated DEGs are represented in blue, while the downregulated ones are in red.

