
FIG 3.
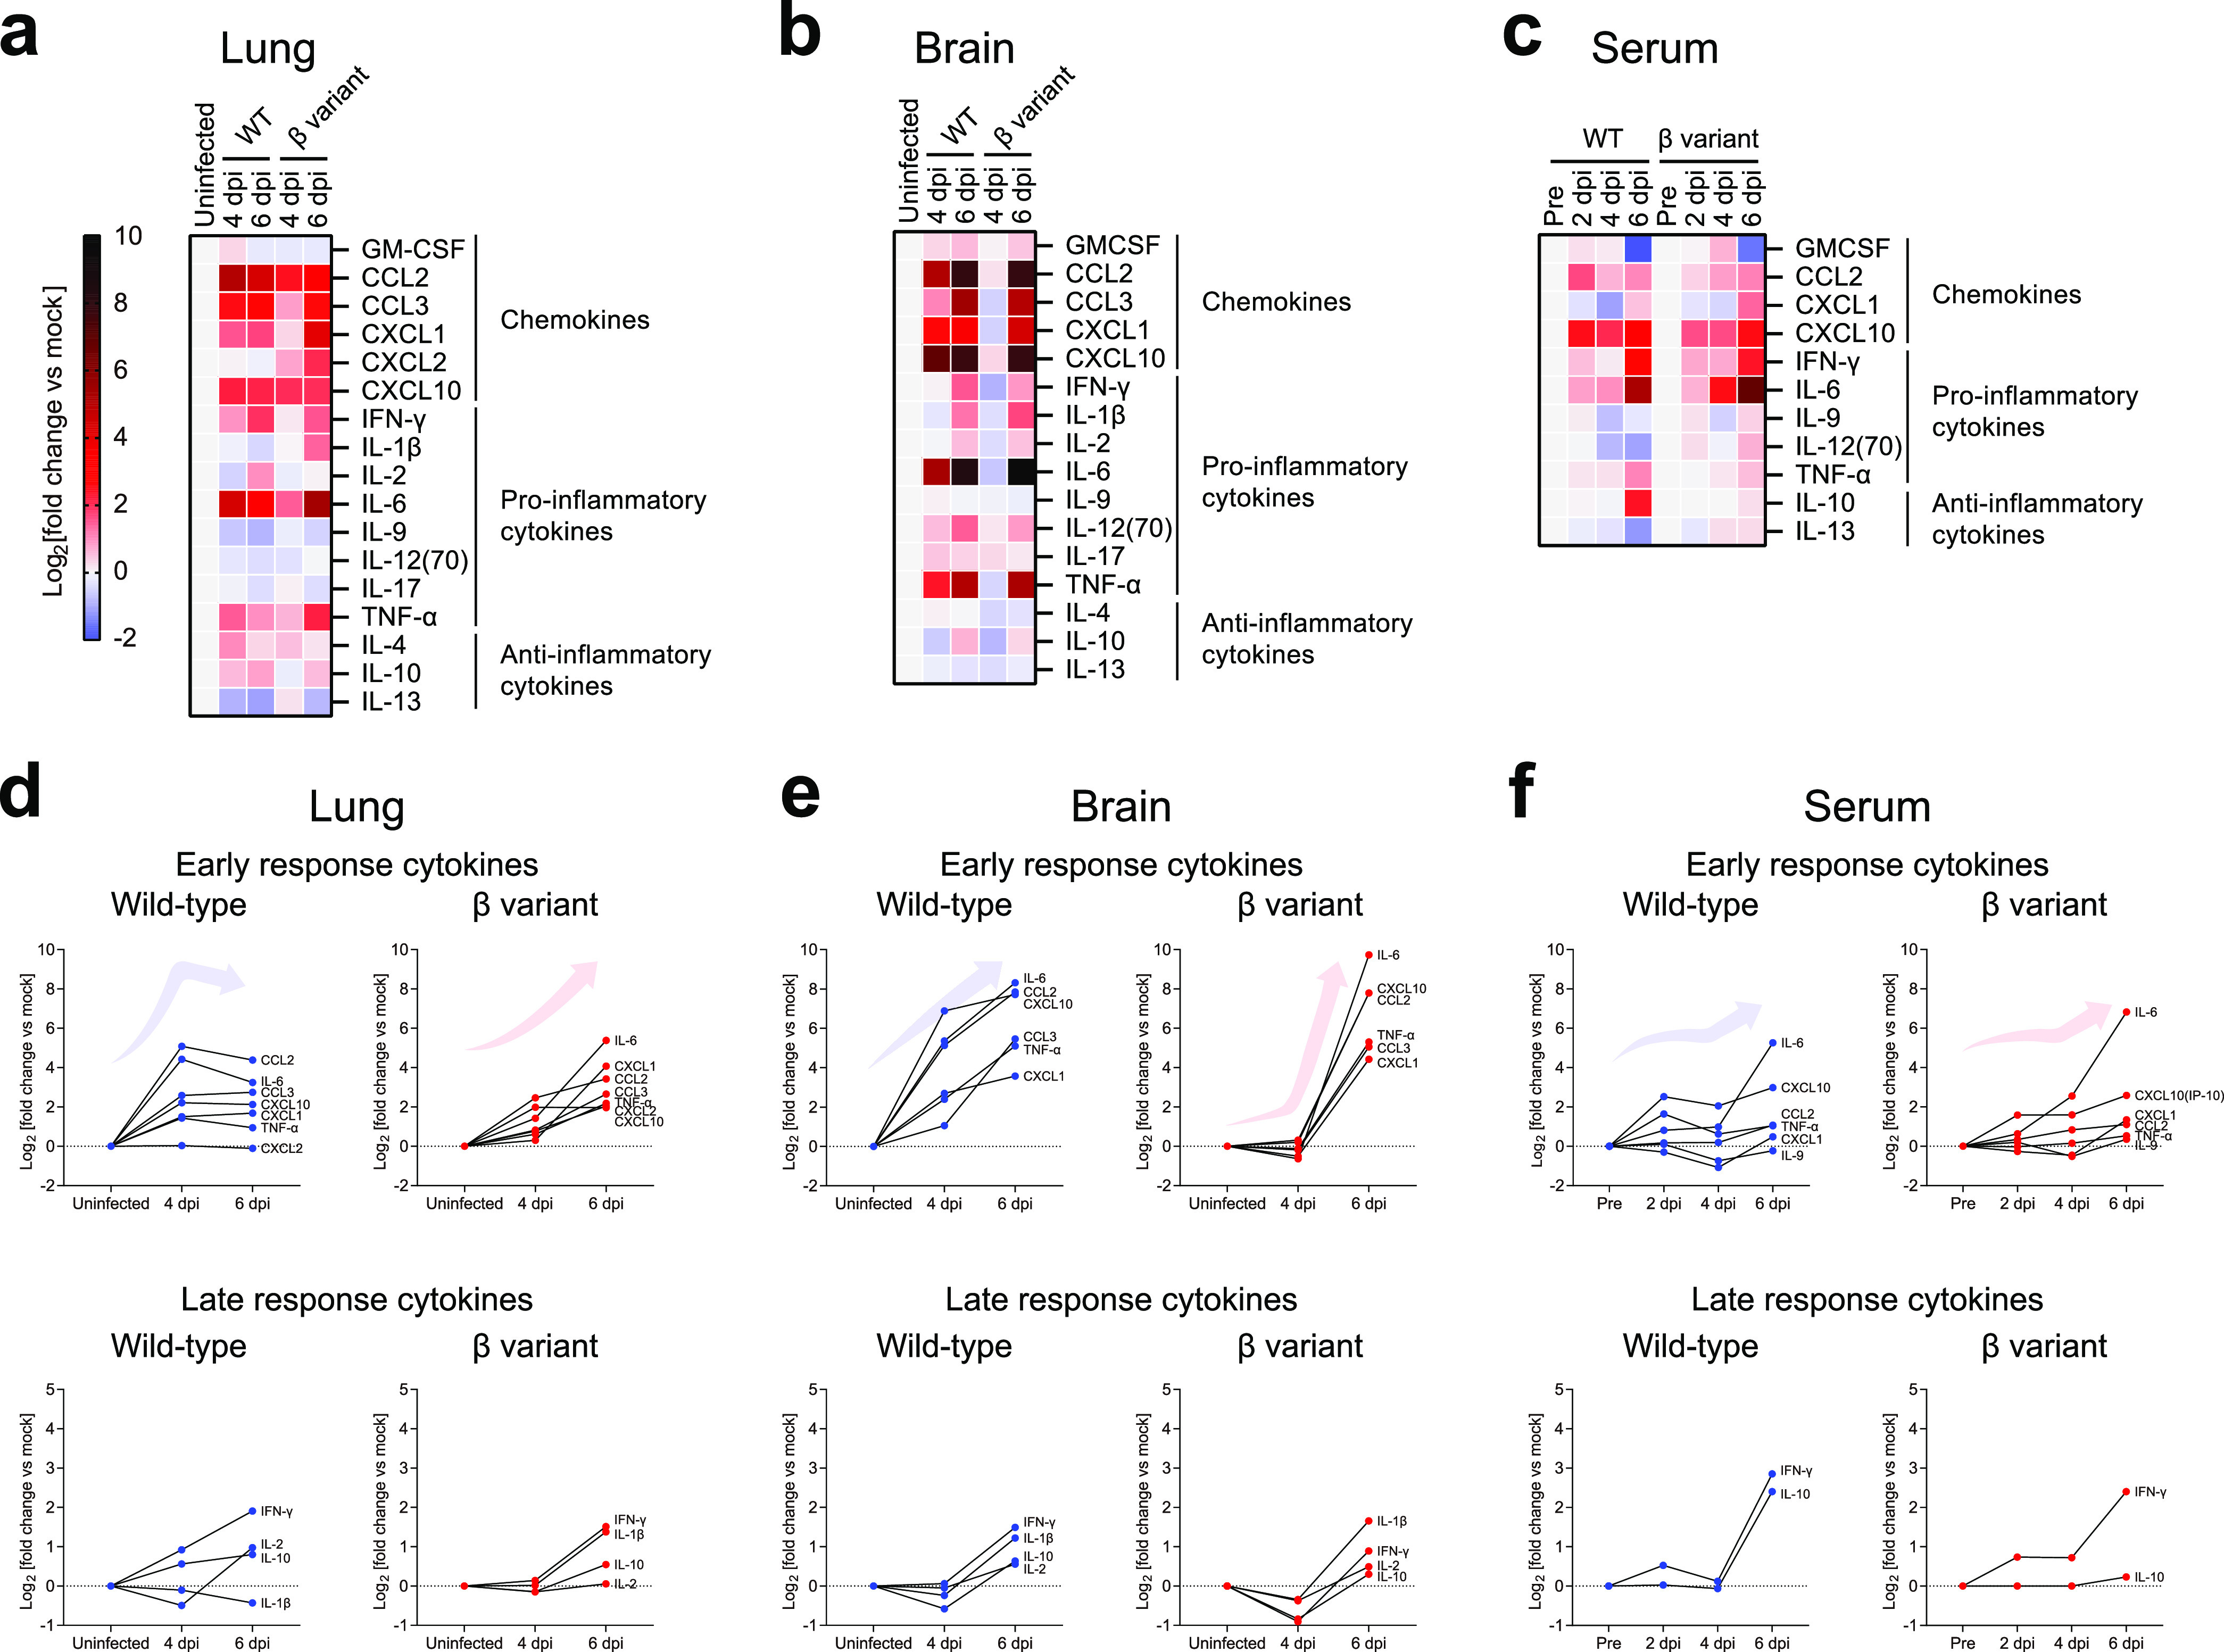
Chemokine and cytokine profiles after SARS-CoV-2 WT or β variant infection. Cytokine levels in the lungs (a and d), brain (b and e), and serum (c and f) from mice infected with SARS-CoV-2 WT (blue symbols) or β variant (red symbols) (five mice per group; two independent experiments) are shown. Uninfected mice (−) (black symbols) were used as controls. For serum analysis, samples collected before infection (pre) were used as controls. Sixteen cytokines were analyzed using a multiplex cytokine assay. The fold change of each cytokine was calculated compared to uninfected controls and plotted in heat maps (a to c) or on graphs (d to f). CXCL2 levels were additionally measured in the lungs by enzyme-linked immunosorbent assay. (a to c) Relative expression levels of chemokines, proinflammatory cytokines, and anti-inflammatory cytokines. (d to f) Relative expression levels of early-response (CCL2/3, CXCL1/10, IL-6, and TNF-α) and late-response (IL-1β/2/10 and IFN-γ) cytokines (see Fig. S4a to d for the actual expression level of each cytokine and statistics).