FIG 4.

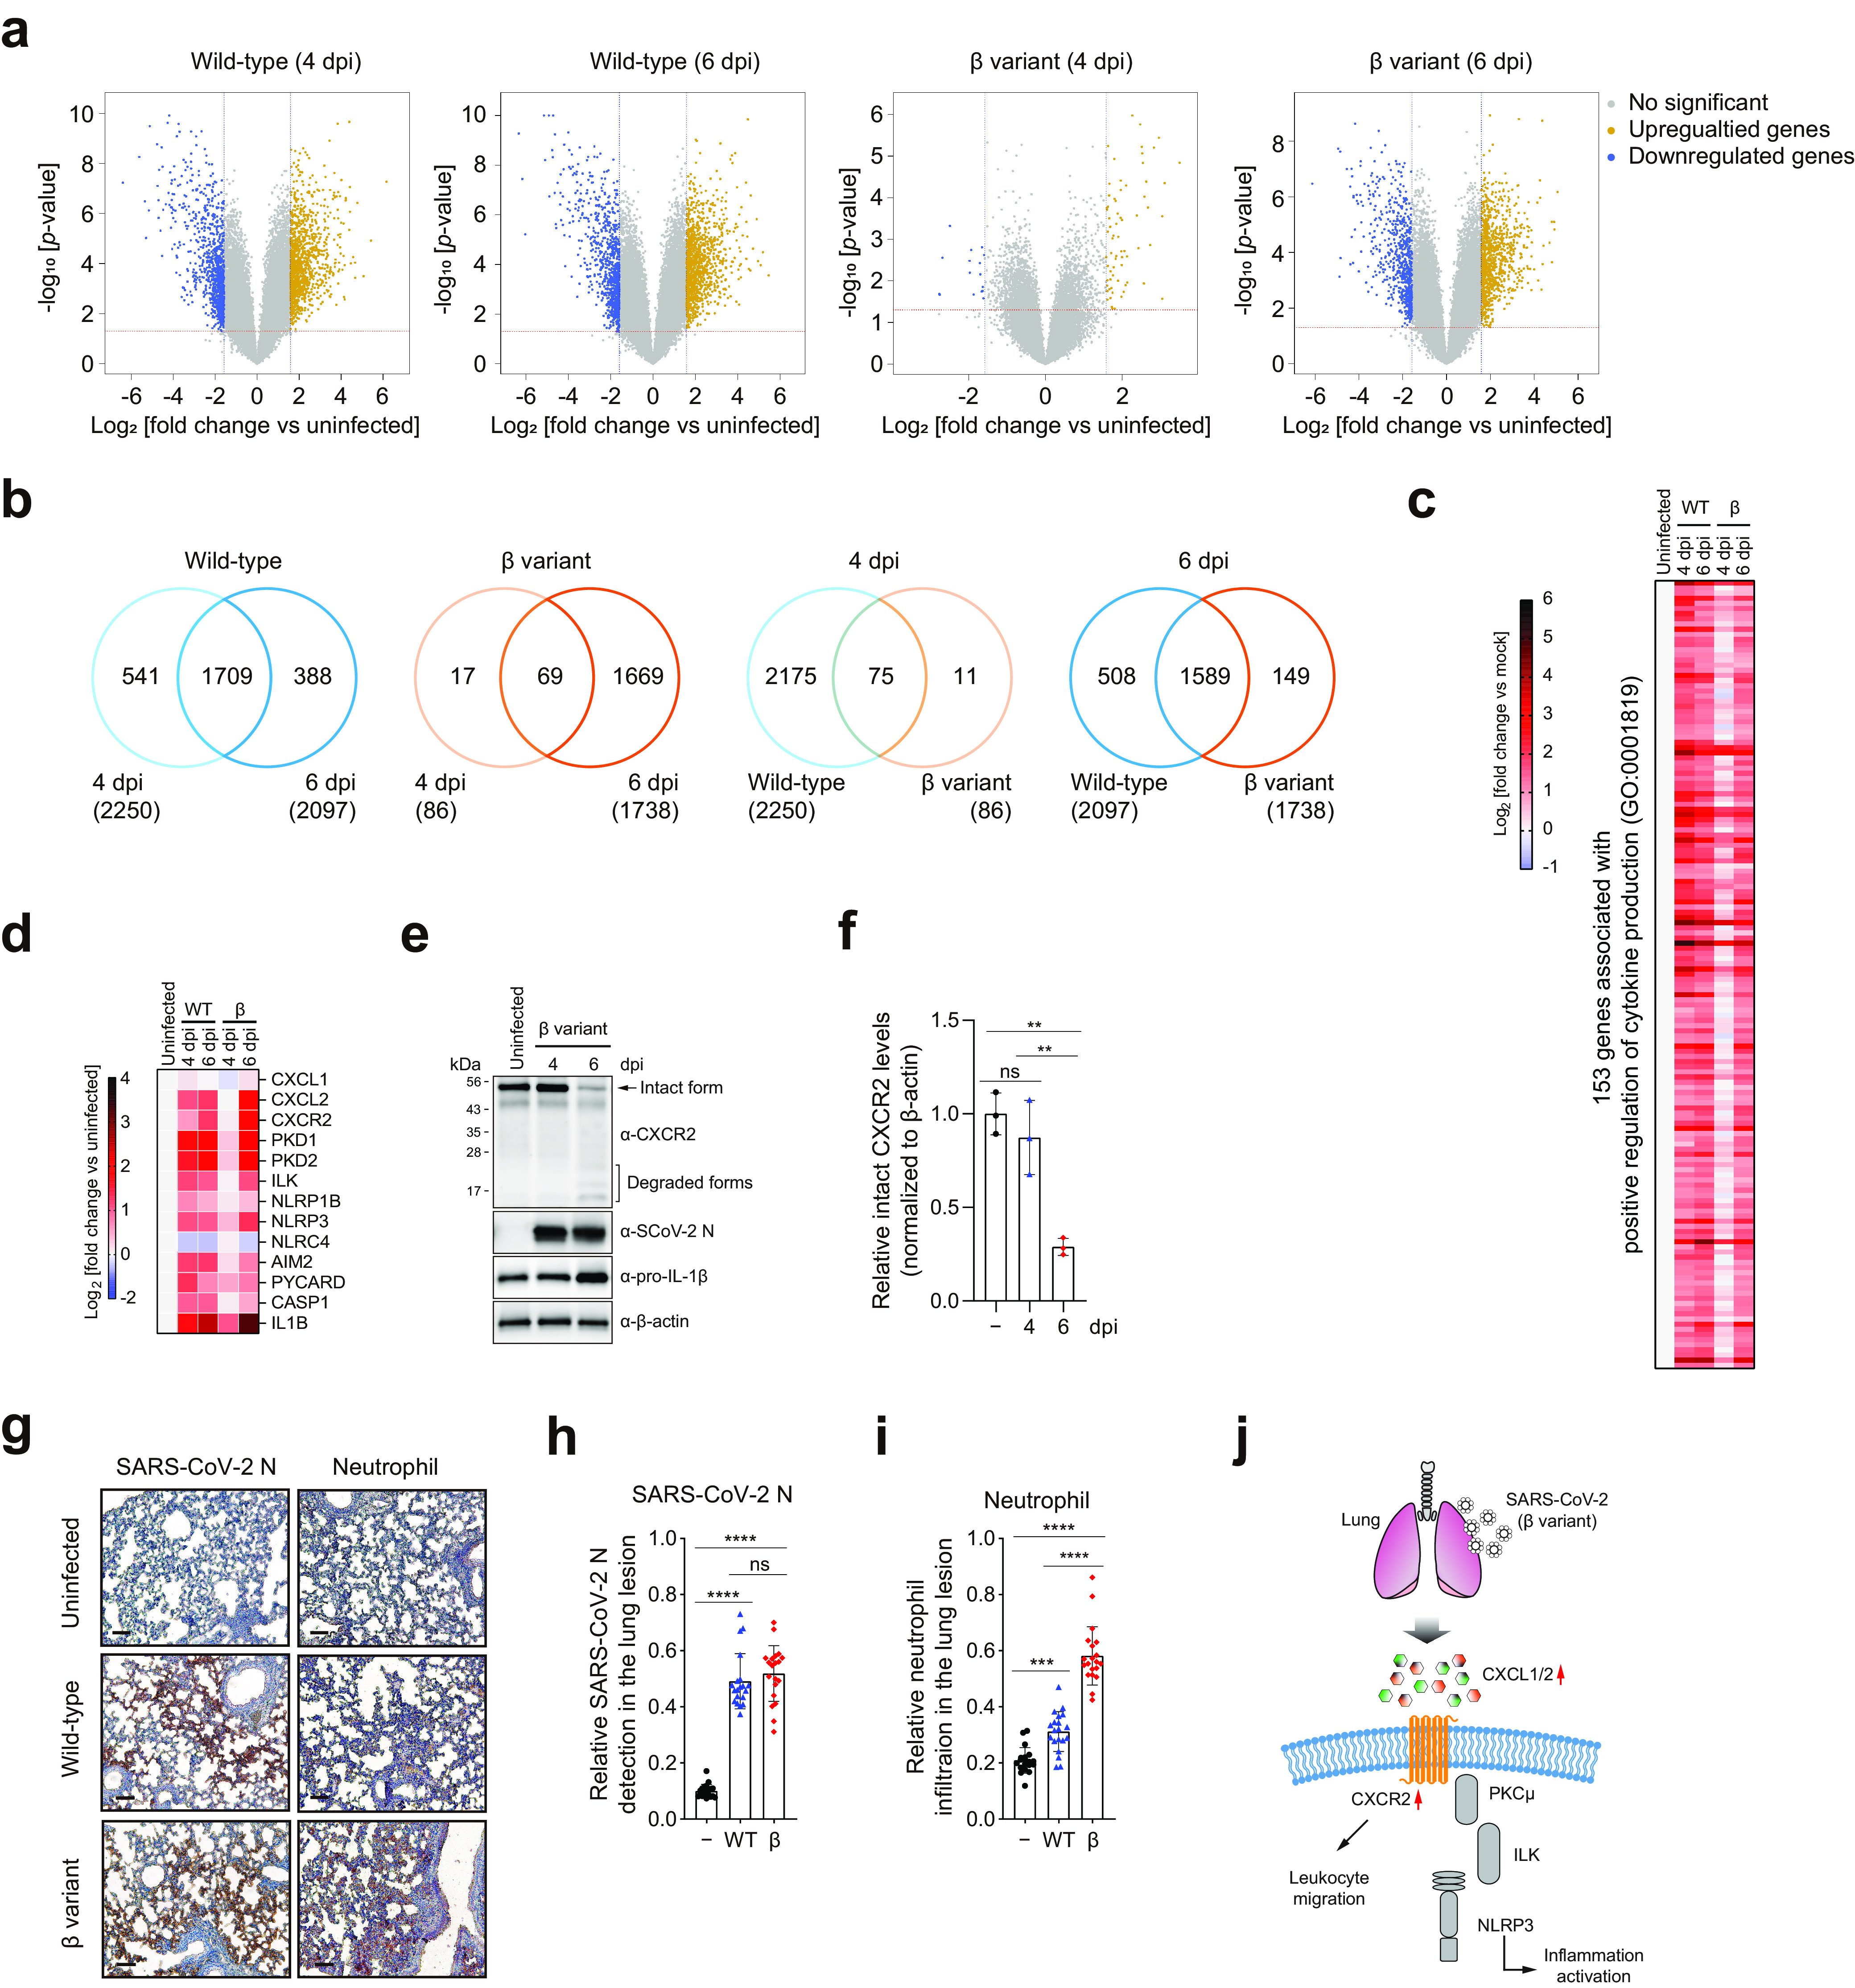
Transcriptome profiling of the lungs of K18-hACE2 mice infected with SARS-CoV-2 WT strain or β variant. (a to d) Whole-transcriptome profiling of lung homogenates was performed by microarray analysis (five mice per group). Uninfected mice were used as controls. (a) Volcano plots of differentially expressed genes (DEGs) in the lungs of virus-infected mice versus uninfected mice at 4 and 6 dpi. Up- and downregulated genes are represented by dark yellow and blue dots, respectively (fold change ≥ 3 [blue vertical dashed lines]; P < 0.05 [red horizontal dashed lines]). (b) Venn diagrams showing the overlap of DEGs between different time points or virus strains compared to uninfected controls. Numbers in parentheses indicate the total number of DEGs. (c) Heat map of significantly upregulated genes annotated with the Gene Ontology (GO) term “positive regulation of cytokine production” (GO:0001819). (d) Heat map of genes involved in inflammasome activation. (e and f) Western blot analysis of the indicated proteins in the lungs of K18-hACE2 mice infected with the β variant of SARS-CoV-2. (e) Representative images (three mice per group). The full-length intact form of CXCR2 is indicated by the arrow. (f) The ratio of intact CXCR2 to β-actin was determined by densitometric analysis. **, P < 0.01 (one-way analysis of variance with Tukey’s multiple-comparison test). (g to i) Neutrophil infiltration into lung lesions. Immunohistochemistry was performed on lung sections from K18-hACE2 mice infected with the WT strain or β variant of SARS-CoV-2 at 6 dpi using an anti-SARS-CoV-2 nucleocapsid (N) protein antibody (left) and a neutrophil marker (right). (g) Representative images (five mice per group) (scale bars, 100 μm). (h and i) SARS-CoV-2 N protein expression (h) and neutrophil infiltration (i) relative to the total lesion area for each of 20 acquired images per group. ***, P < 0.001; ****, P < 0.0001 (one-way analysis of variance with Tukey’s multiple-comparison test). (j) Schematic of the NLRP3 inflammasome signaling pathway.
