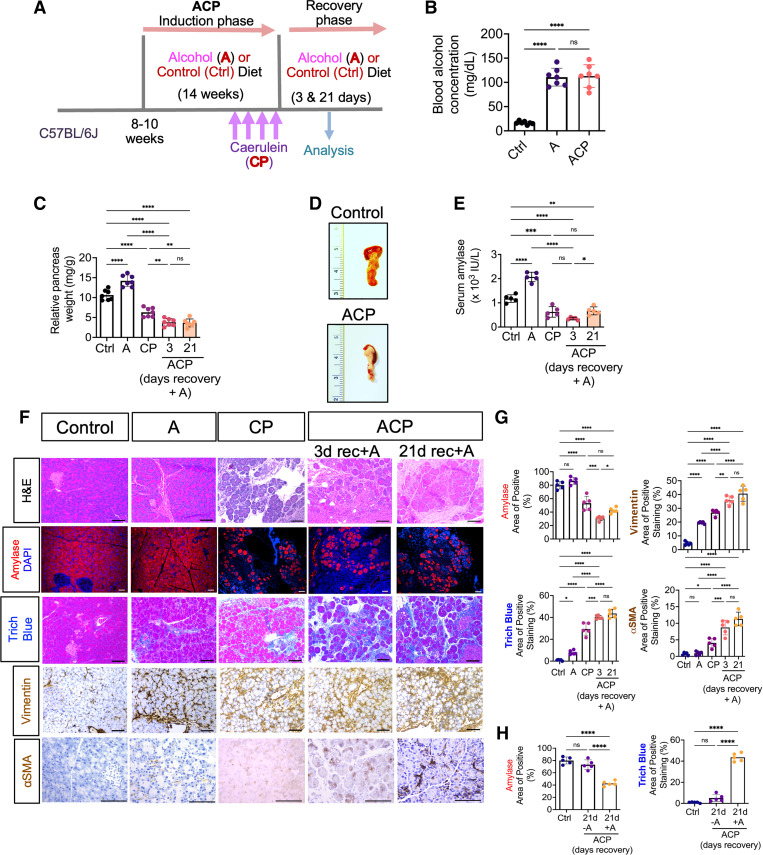
Figure 1.
Effect of alcohol continuation on mice pancreatic histology with established alcoholic chronic pancreatitis (ACP). A: schematic showing the protocol of alcoholic chronic pancreatitis (ACP) induction in C57BL/6 mice exposed to ethanol (alcohol) enriched liquid diet (A) and repetitive caerulein administration (or recurrent acute pancreatitis) to establish chronic pancreatitis (CP) model. Mice were euthanized after 3 and 21 days of recovery period after the last episode of CP induction with (+A) or without (−A) continuing alcohol intake to harvest pancreas and blood for analysis (see Table 1). B: blood alcohol concentration was measured and expressed as (mg/dL), in control, alcohol alone (A), and ACP induced (with continued alcohol for 3 days) C57BL/6 mice. C: relative pancreas weight (pancreas weight/body weight) measurements of C57BL/6 mice in A, CP, and ACP-induced with continued alcohol groups. D: representative images of mouse pancreas showing significant atrophy and loss of acinar tissue mass after ACP induction (with continued alcohol for 3 days) as compared with control mouse pancreas. E: measurements of serum amylase activity in control, A, CP, and ACP-induced C57BL/6 mice. F: H&E based histological assessment of pancreas harvested from control, A, CP, and ACP-induced C57BL/6 mice groups. Representative photomicrographs of immunofluorescence (IF)-based imaging analysis of acinar cell specific amylase expression (shown in red) in the pancreatic tissue sections of A, CP, and ACP-induced mice. Representative histological sections of pancreas showing collagen levels (trichrome blue) and PSC activation (vimentin and αSMA) immunohistochemical expression in control, A, CP, and ACP-induction with continued alcohol for 3- and 21-days during recovery phase. Scale bar, 50 μm. G: quantitative assessment of amylase expression, collagen deposition, and PSC activation markers in pancreata harvested from each experimental group is shown. H: quantitative histological assessment analysis of amylase expression and collagen deposition on pancreatic tissue sections obtained from control and ACP with 21 days of recovery phase with and without alcohol. Individual data points with means ± SD are shown and compared by one-way ANOVA. *P < 0.05; **P < 0.01; ***P < 0.001; ****P < 0.0001. n = 5−7 mice/group. H&E, hematoxylin and eosin; ns, nonsignificant; PSC, pancreatic stellate cell.

