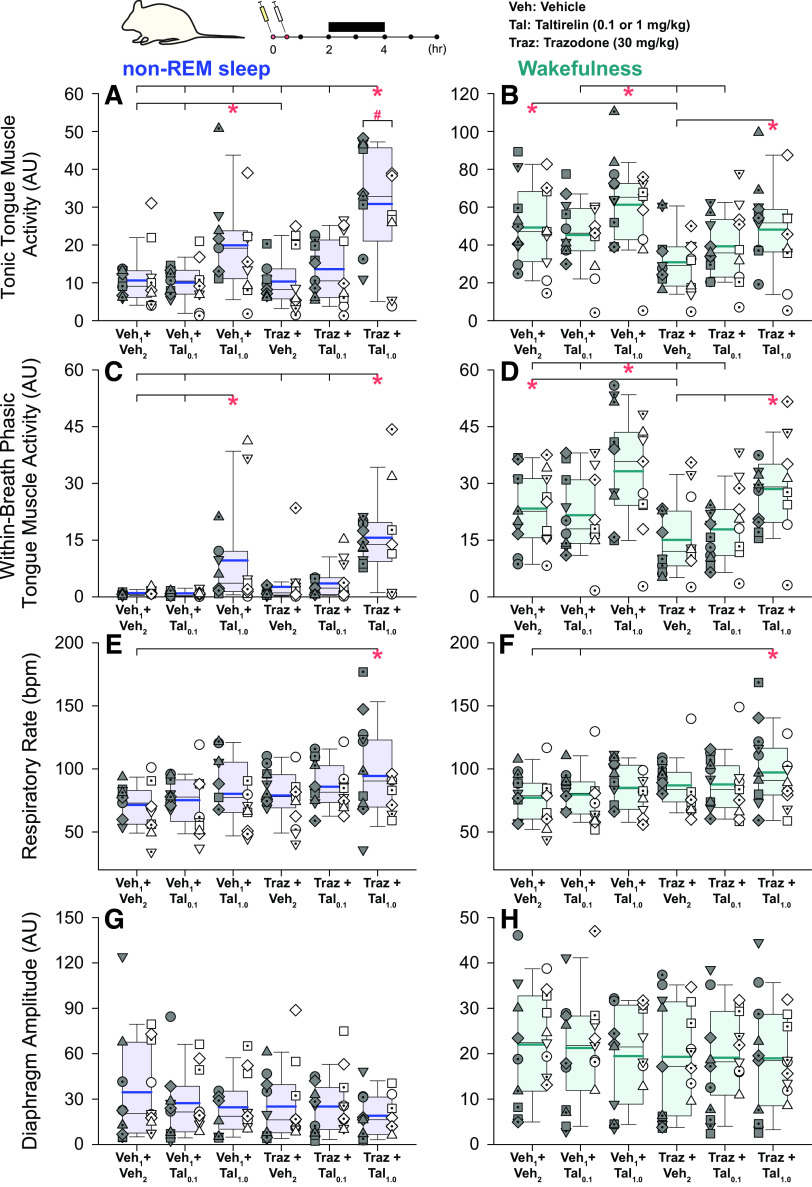
Figure 2.
Individual and average effects of the different experimental interventions on tongue and diaphragm motor activities. Box (25th and 75th percentiles) and whisker (5th and 95th percentiles) plots show the individual and group data after intraperitoneal injections of taltirelin, with or without coadministration of trazodone, compared with the respective vehicle controls. Data are shown for non-rapid eye movement (non-REM) sleep (left) and wakefulness (right) for tonic tongue muscle activity (A and B), within-breath phasic tongue muscle activity (C and D), respiratory rate (E and F), and diaphragm amplitude (G and H). Individual data points from each animal are superimposed on these group data plots with each animal represented by a different symbol; the individual-specific symbols are consistent across the different experimental interventions on this and other figures. The box and whisker plots represent data from the group of 19 animals (both sexes, no individual symbols), with individual data in males (n = 10) and females (n = 9) on the left and right, respectively, of each group plot. The group mean and median are shown by the thicker and thinner lines. The symbols “*” and “#” indicate P < 0.05 between the indicated experimental conditions (*) or sex (#). AU, arbitrary units; bpm, breaths per minute; Tal, taltirelin; Traz, trazodone; Veh, vehicle. See text for further details.

