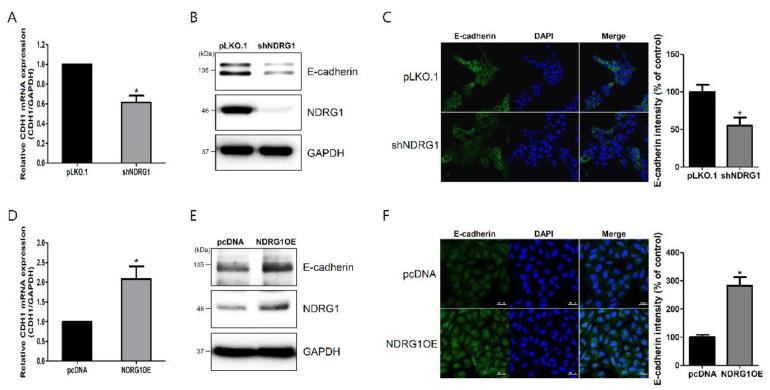
Figure 4.
NDRG1 positively regulated E-cadherin expression in endometrial epithelial cells. (A) Effect of NDRG1 depletion on CDH1 mRNA expression in RL95-2 cells. (B) Effect of NDRG1 depletion on E-cadherin protein expression in RL95-2 cells. (C) Immunofluorescence images of E-cadherin expression following NDRG1 depletion in RL95-2 cells. (D) Effect of NDRG1 overexpression on CDH1 mRNA expression in AN3-CA cells. (E) Effect of NDRG1 overexpression on E-cadherin protein expression in AN3-CA cells. (F) Immunofluorescence images of E-cadherin expression induced by NDRG1 overexpression in AN3-CA cells. All images are shown at 400× magnification. Scale bars indicate 20 μm. Nuclei were stained with 4′,6′-diamidino-2-phenylindole dihydrochloride (DAPI). Quantification of immunofluorescence images using image J. The data shown represent the mean ± SEM from three independent experiments (n = 3). * p < 0.05.

