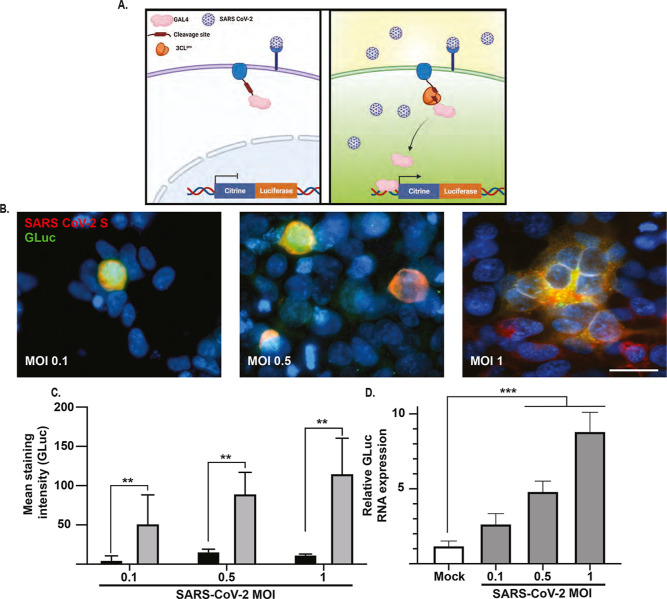
Figure 3.
SARS-CoV-2 infection activates the live-cell reporter. (A) Schematic of SARS-CoV-2 cell infection activating the reporter signal. Representative immunofluorescence staining for SARS-CoV-2 spike and GLuc in infected cells 24 hpi. Scale bar—20 μm. (B) Reporter cells were infected with SARS-CoV-2 using different MOI, and 24 hpi cells were immunostained for SARS-CoV-2 spike and GLuc. (C) The staining intensity of GLuc was compared between SARS-CoV-2 positive and negative cells in four random fields. Data was plotted as mean ± SD. Analysis was performed using a two-tailed Student’s t-test, N = 4, ** = p ≤ 0.01. (D) Relative GLuc expression levels in SARS-CoV-2 infected cells normalized to 18s ribosomal RNA (18s rRNA), 24 hpi. Data was plotted as mean ± SD. Statistical analysis was performed using a two-tailed Student’s t-test, N = 3, *** = p ≤ 0.005.

