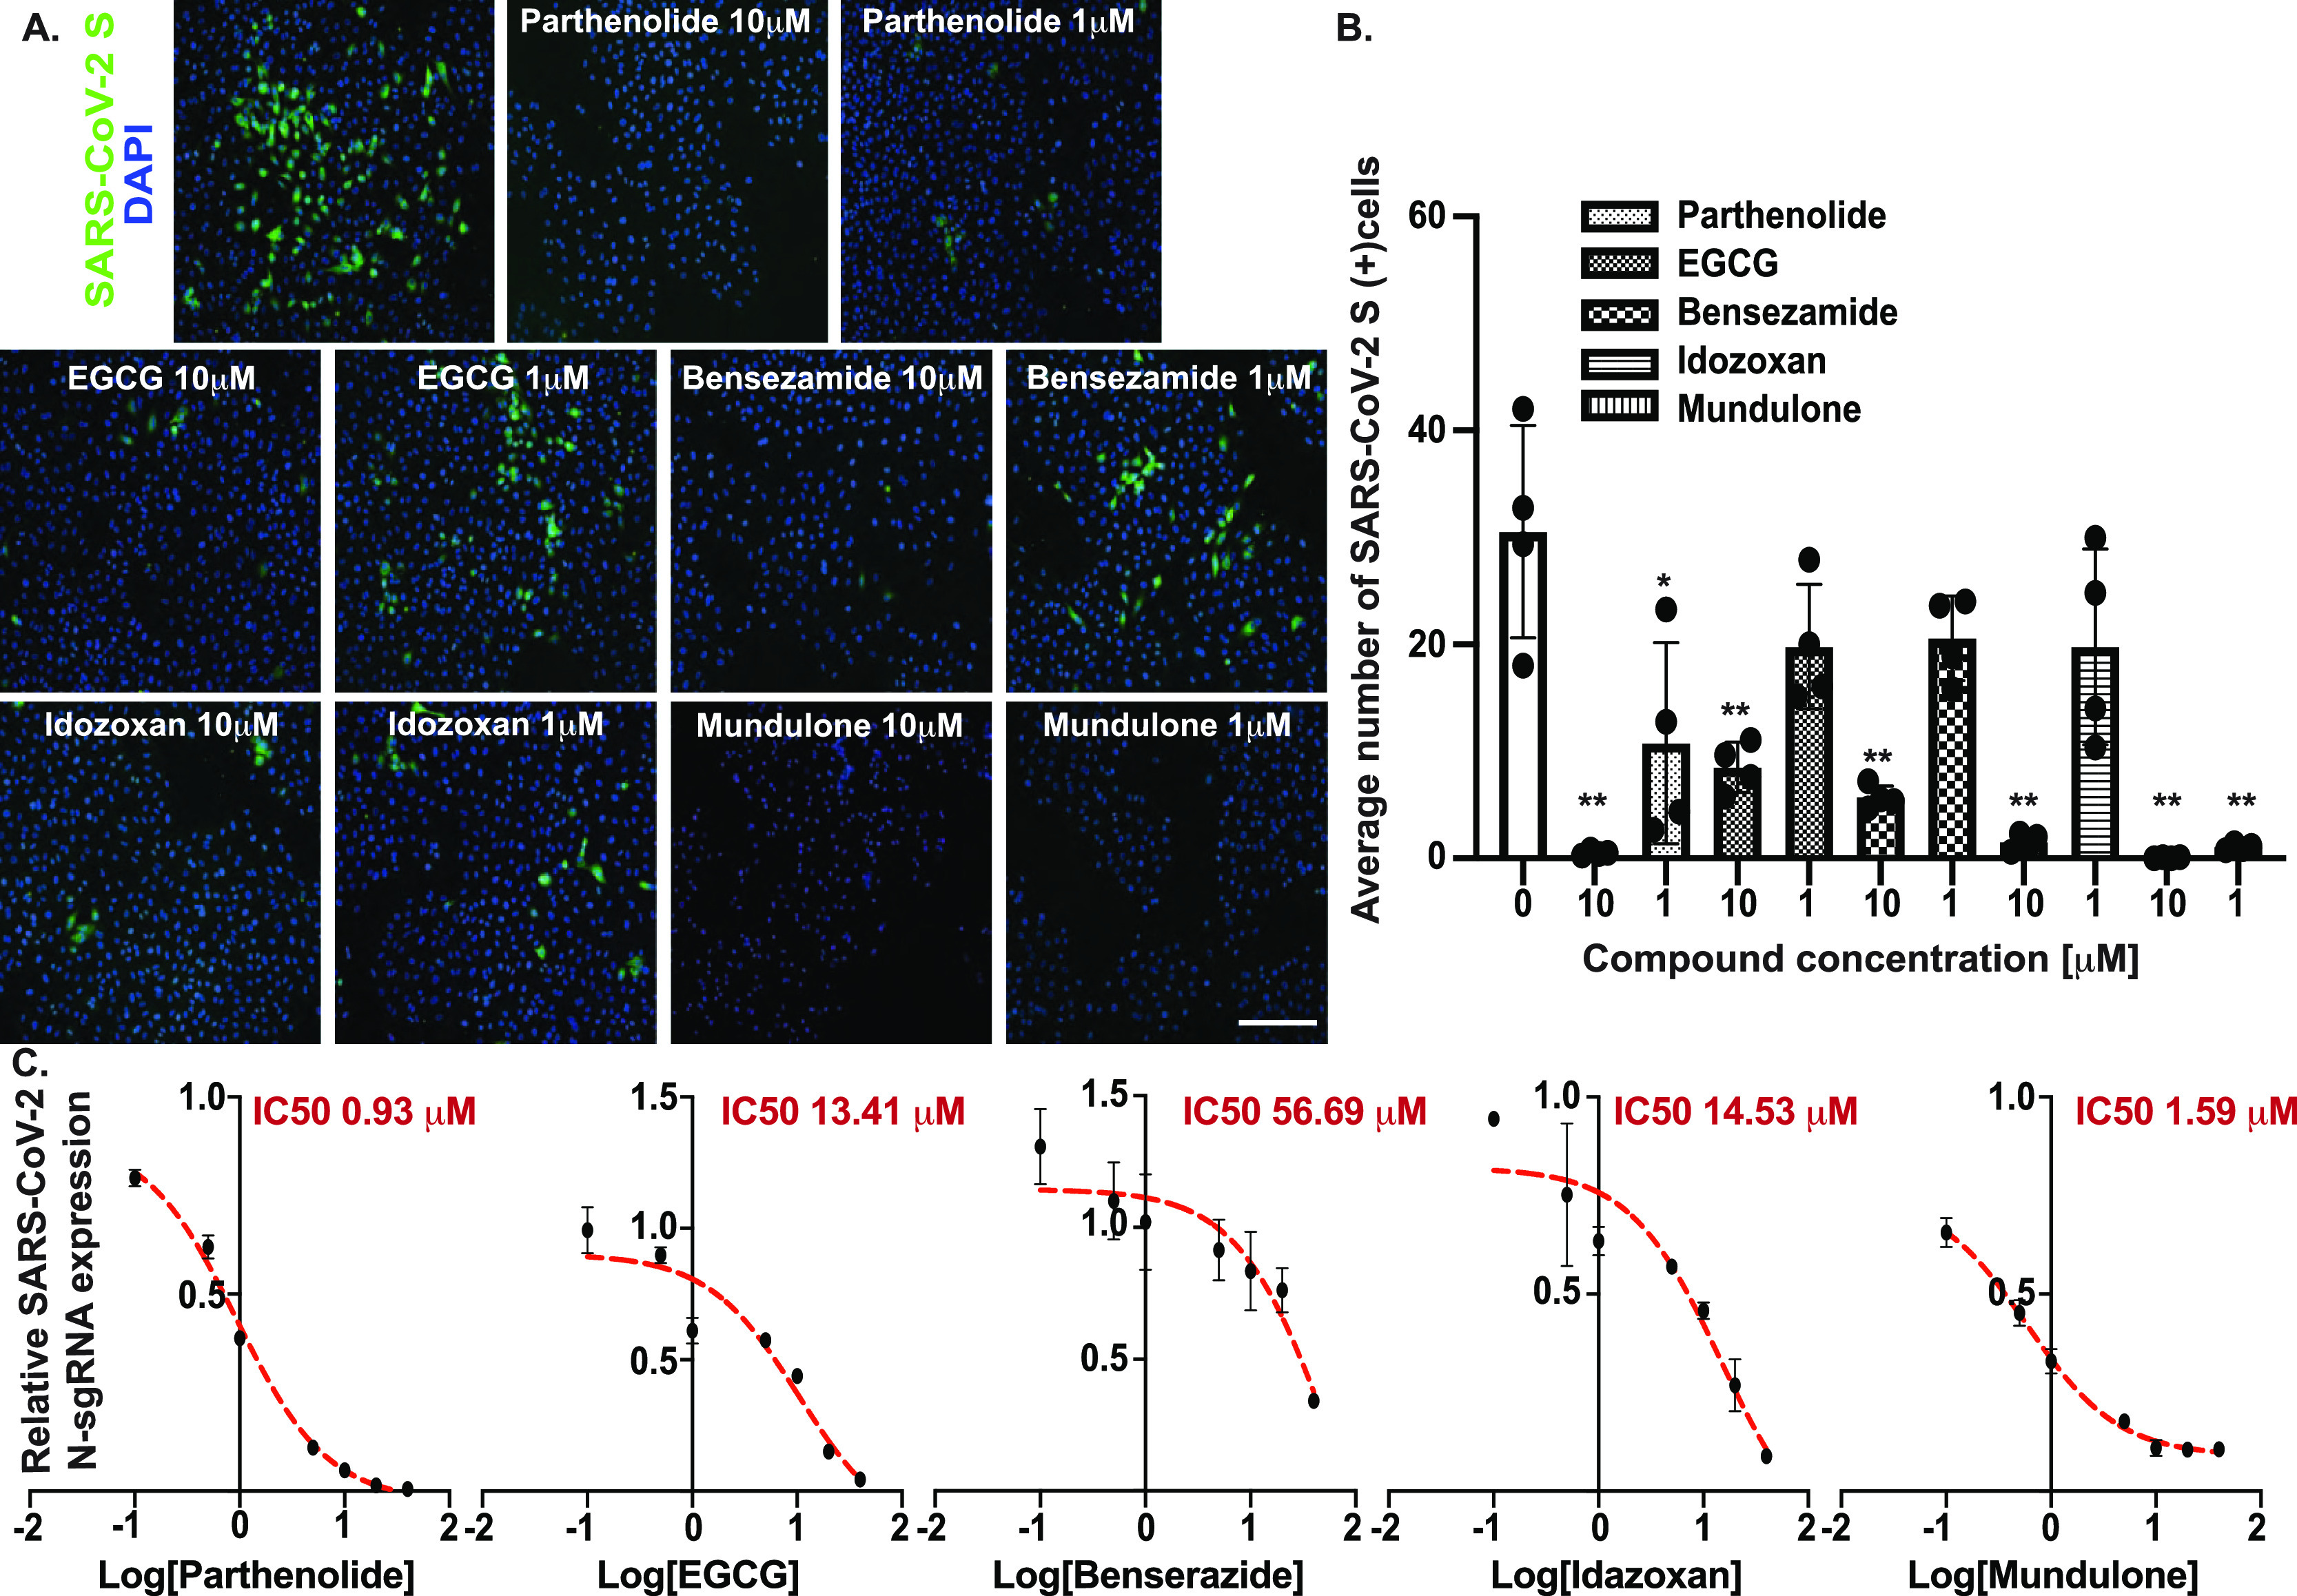
Figure 5.

Identified compounds SARS-CoV-2 inhibition evaluation in lung epithelial cells. (A) A549-ACE2 cells were infected with SARS-CoV-2 (MOI = 0.1) and treated with the identified compounds in the indicated concentrations or with vehicle; 24 hpi cells were immuno-stained for SARS-CoV-2 spike protein (SARS-S). Scale bar = 100 μm. (B) Quantification summary of the percentage SARS-CoV-2 positive cells; images from four random fields were analyzed, and the percentage of SARS-S+ cells was determined. Data was plotted as mean ± SD, N = 3. Analysis was performed using a two-tailed Student’s t-test, N = 3, ** = p ≤ 0.01. (C) Relative SARS-CoV-2 viral RNA expression in A549-ACE2-infected cells (24 hpi) treated with the identified compounds in the indicated concentrations. Total extracted RNA was evaluated for the presence of SARS-CoV-2 subgenomic N transcripts, and the expression level was calculated relative to the vehicle-treated group. Data was plotted as mean ± SD, N = 3. Analysis was performed using a two-tailed Student’s t-test, N = 3, ** = p ≤ 0.01.
