Figure 6.

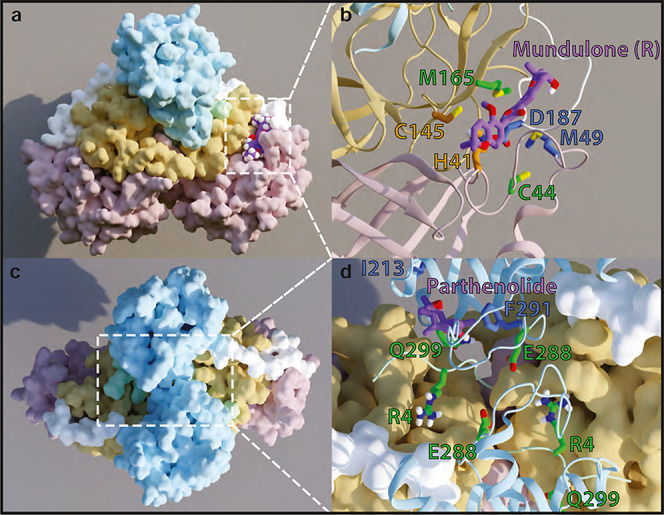
Illustration of the mode of inhibitor binding to 3CLpro in the catalytic site and the dimerization interface site. The figure panels obtained from representative frames from the MD simulation trajectories show preferred modes of binding for the MND-R that prefers the catalytic site (panels A,B) and for PRT which prefers the dimerization interface site (panels C,D). Panels (A,C) present the protein domains in different colors (domain 1 in pink; 2 in yellow; 3 in light blue; N-finger in mint; and linker loop in white). Panels (B,D) zoom into the binding site regions showing the inhibitors in purple, the residues probed by mutagenesis in green, and residues with the largest contributions to the BFE in blue.
