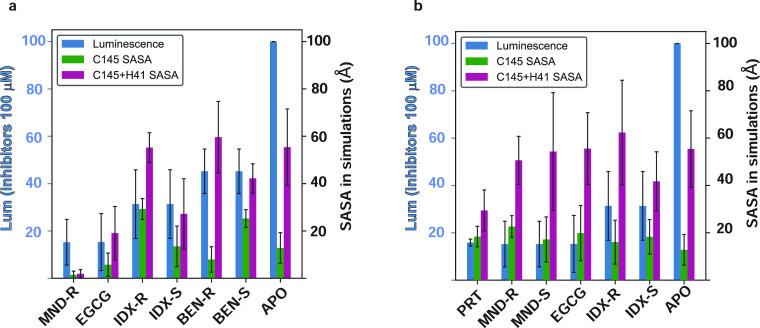
Figure 7.
Relation between the extents of occlusion of the catalytic residues by inhibitor binding and the inhibitory efficiency measured by luminescence. The SASA of the catalytic residues (C145 alone, green bars; the combined C145/H41 dyad, maroon bars) was calculated in the trajectories of the 3CLpro dimer complexes with inhibitor bound at the orthosteric (catalytic) site (left panel) and at a dimerization interface site (right panel). The occlusion was quantified by comparing the SASA calculated in the presence of each inhibitor to the SASA values in the apo simulation trajectory. The rank order of occlusion is seen to agree with the ranking of the experimentally measured inhibitory efficiency quantified by the reduction in luminescence produced by each inhibitor.

