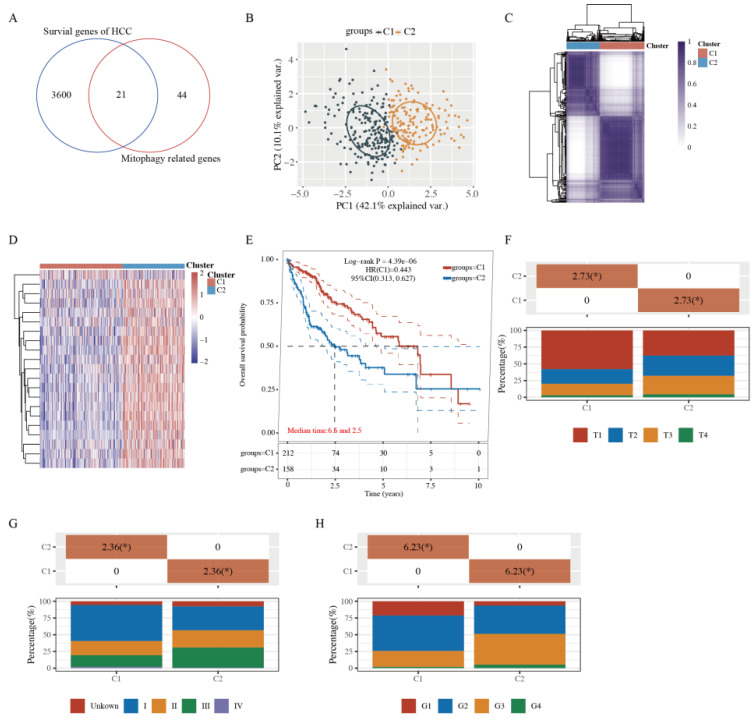
Figure 1.
Tumor classification based on the mitophagy-related genes. (A) 21 mitophagy- and prognosis-related genes between these two groups. (B,C) Principal components analysis (PCA) (B) and consensus-clustering matrix (C) of 371 samples from the TCGA dataset for k = 2. (D) Heatmap of mitophagy-related gene expression in different clusters (C1, C2). Red represents high gene expression, and blue represents low expression. (E) The Kaplan–Meier curve of overall survival of patients with HCC in two clusters. (F) The degree of progression of the primary tumor (T) at diagnosis in the two clusters. (G) Distribution of stage at diagnosis in the two clusters. (H) The grades (G) of tumors in the two clusters. * indicates a significant difference in the distribution of the clinical features between the two groups (p < 0.05).

