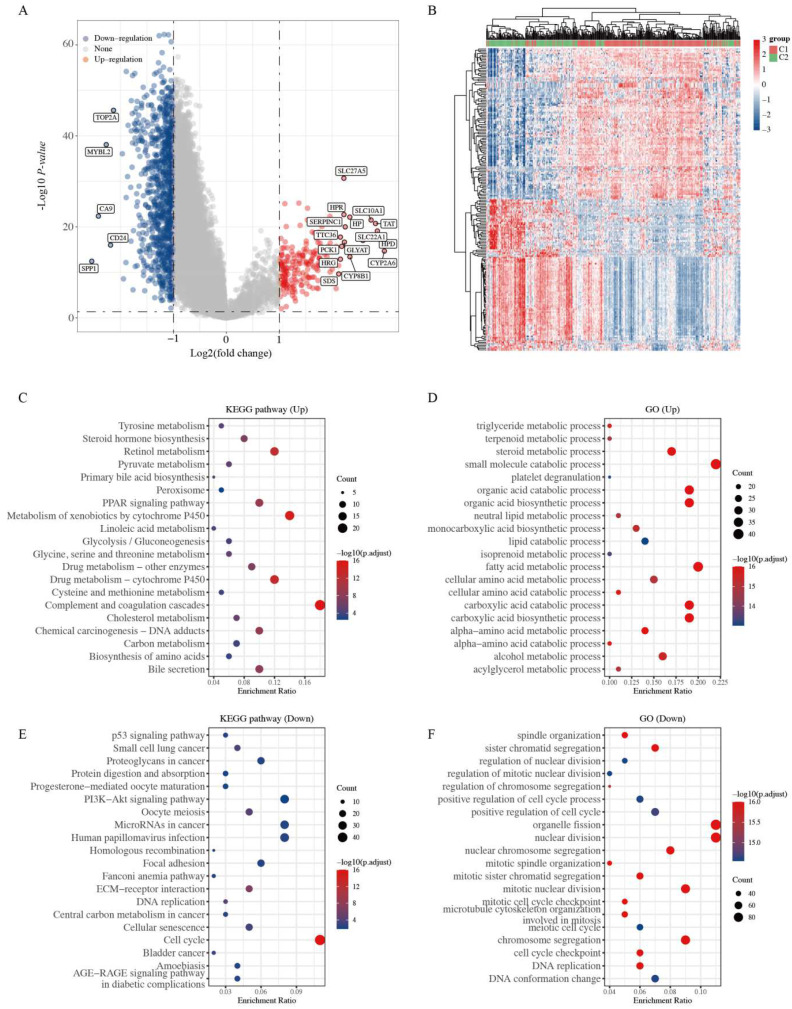
Figure 2.
Identification of DEGs between the two clusters grouped by mitophagy-related gene set and functional enrichment analysis. (A) Volcano plot of DEGs between two clusters with different mitophagy-related gene expression. The red and blue points represent up- and downregulated genes with statistical significance, respectively. (B) Heatmap of the top 50 up- and downregulated genes with the most differential changes. (C,D) KEGG/GO analysis of DEGs that were upregulated in cluster 1. (E,F) KEGG/GO analysis of DEGs that were downregulated in cluster 1. DEG: differentially expressed genes.

