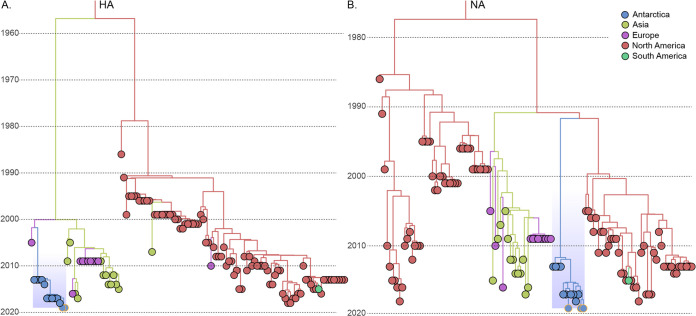
FIG 2.
Phylogeographic analysis of the hemagglutinin and neuraminidase genes of the influenza A virus H11N2 samples from Antarctica. The time-scaled Bayesian maximum clade credibility (MCC) trees of the HA (n = 123) (A) and NA (n = 125) (B) genes are shown. The inherent locations of tips and nodes in the trees are represented according to the color key in the top right corner. The Antarctic cluster is highlighted in light blue in both trees. Sequences from this study are highlighted by orange outlines.

