FIG 3.
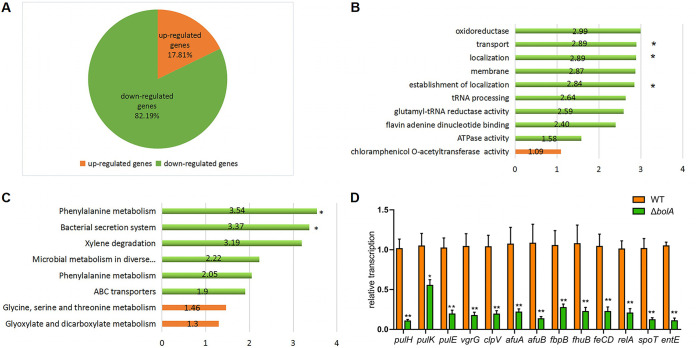
Transcriptome analysis between the WT and ΔbolA strains. (A) Pie chart of 146 genes significantly regulated by bolA gene. The number of genes significantly downregulated or upregulated is indicated in green and orange, respectively. (B) Graphical representation of the gene GO enrichment analysis was in “biological process,’’ “cellular component,” and “molecular function” categories for genes downregulated or upregulated in response to the bolA gene. *, P value associated with the enrichment test was lower than 1 × 10⁻⁴. No asterisk indicates that the P value associated with the enrichment test was between 1 × 10⁻² and 1 × 10⁻⁴. (C) Functional classification of KEGG pathway. The KEGG enrichment pathways were summarized in eight main pathways. *, P value associated with the enrichment test was lower than 0.01. No asterisk indicates that the P value associated with the enrichment test was between 0.01 and 0.05. In all, the bar length corresponds to the average log2 change (in the absolute value of the ΔbolA/WT ratio) of the genes significantly upregulated or downregulated associated with each KEGG or GO enrichment pathway, and the red graphic shows upregulated pathways and the green the downregulated pathways. (D) Results of the expression of genes related to T2SS, T6SS, siderophores, and ppGpp synthesis between WT and ΔbolA strains. The expression levels of these genes were detected by RT-qPCR, and the experiments were carried out in triplicate with three independent RNA samples. Student's t test with GraphPad Prism software was used to analyze the continuous data obtained by RT-qPCR. *, P < 0.05; **, P < 0.01.

