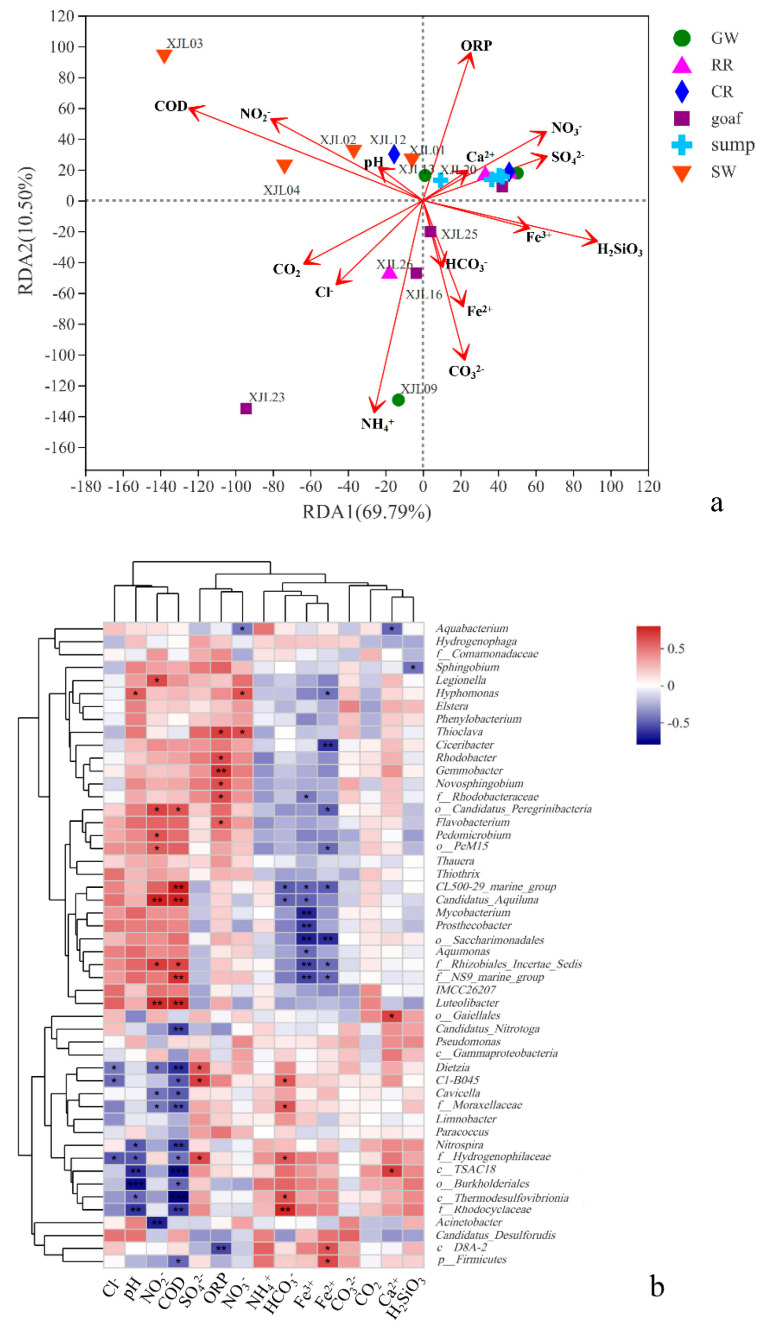
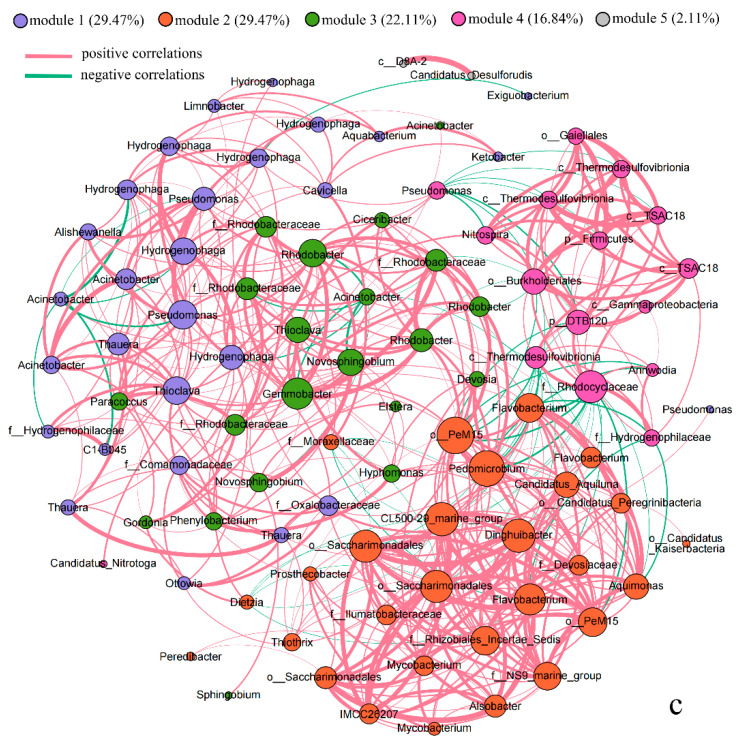
Figure 6.
(a) RDA of the relations between the selected environmental variables and microbial communities in water samples. The red arrows represent the environmental variables, the length of which can represent the impact degree of environmental factor on species data. The angle between the different environmental factors arrows represents positive (acute angle) or negative (obtuse angle) or no correlation (right angle) between the environmental factors. Points with different colors or shapes represent different water samples, and the distances between points represent the similarity of the two samples. When projecting from the sample point to the environmental factor arrow, the distance from the projection point to the origin represents the relative impact of environmental factor on the sample community distribution. (b) Heatmap of Spearman’s rank correlation coefficients between environmental variables and the top 50 microbial phylotypes on genus levels. The correlation coefficients are indicated by hue (* 0.01 < p ≤ 0.05, ** 0.001 < p ≤ 0.01, *** p ≤ 0.001). Note: GW, RR, CR, goaf, sump, and SW refer to groundwater aquifers, rock roadways, coal roadways, goafs, water sumps, and surface waters, respectively. (c) Network of co-occurrence bacterial genera, based on correlation analysis (top 100 most abundant OTUs). The size of each node is proportional to the number of connections; the thickness of each connection between two nodes is proportional to the absolute value of Spearman’s correlation coefficients. The connections indicate strong (|r| > 0.6) and significant (p < 0.05) Spearman correlations.


