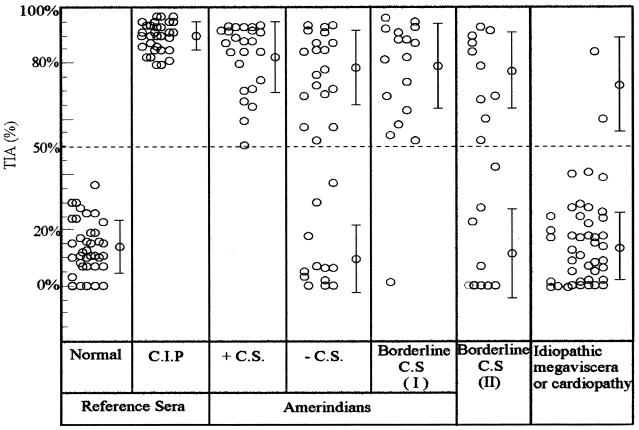
FIG. 1.
Sensitivity of TIA. TIA values are for sera from Amerindians from Paraguay that were positive, negative, and borderline by CS (group I) and samples from patients from regions of endemicity in Paraguay with borderline results by CS (group II) and patients with idiopathic cardiopathy or megaviscera. TIA values for sera from healthy individuals and chronically infected patients (CIP) obtained from blood banks in Argentina (negative and positive control groups, respectively) are shown as a reference. Pooled normal human serum from a region of nonendemicity was used to assign 0% inhibition. Cutoff values were set at 50% inhibition. The mean ± standard deviation is indicated for each group.

