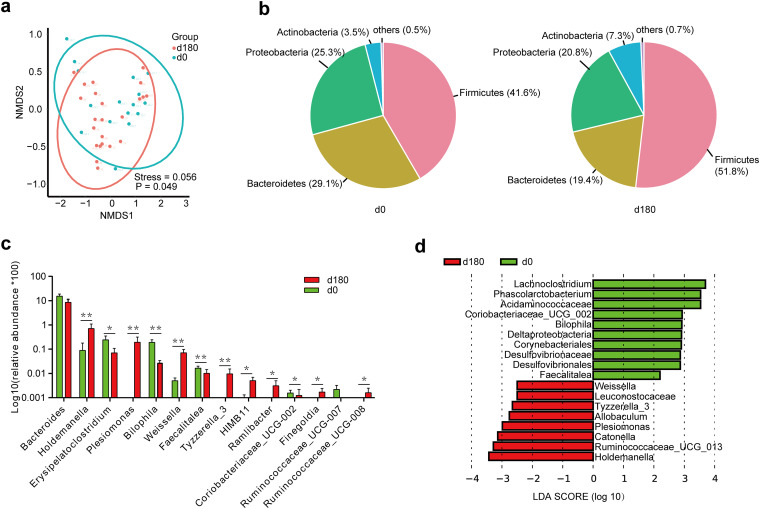
FIG 1.
16S rRNA gene sequencing of bacteria in feces. (a) Nonmetric multidimensional scaling (NMDS) analysis based on the weighted UniFrac distance algorithm and the ANOSIM method between day 0 (d0) and day 180 of the voyage. The horizontal axis (NMDS1) and the vertical axis (NMDS2) are two sorting axes. (b) Pie charts of differences at the phylum level between day 0 and day 180 of the voyage. (c) Bar plot of the differential relative abundances of bacterial genera between day 0 and day 180 of the voyage. *, P < 0.05; **, P < 0.01. (d) Linear discriminant analysis effect size (LEfSe). Analyses of differential species abundances, evolutionary branches, and differential species scores between day 0 and day 180 of the voyage were performed. Red bars indicate relatively high-abundance species at the end (day 180) of the voyage, and green bars indicate relatively high-abundance species at the start (day 0) of the voyage.

