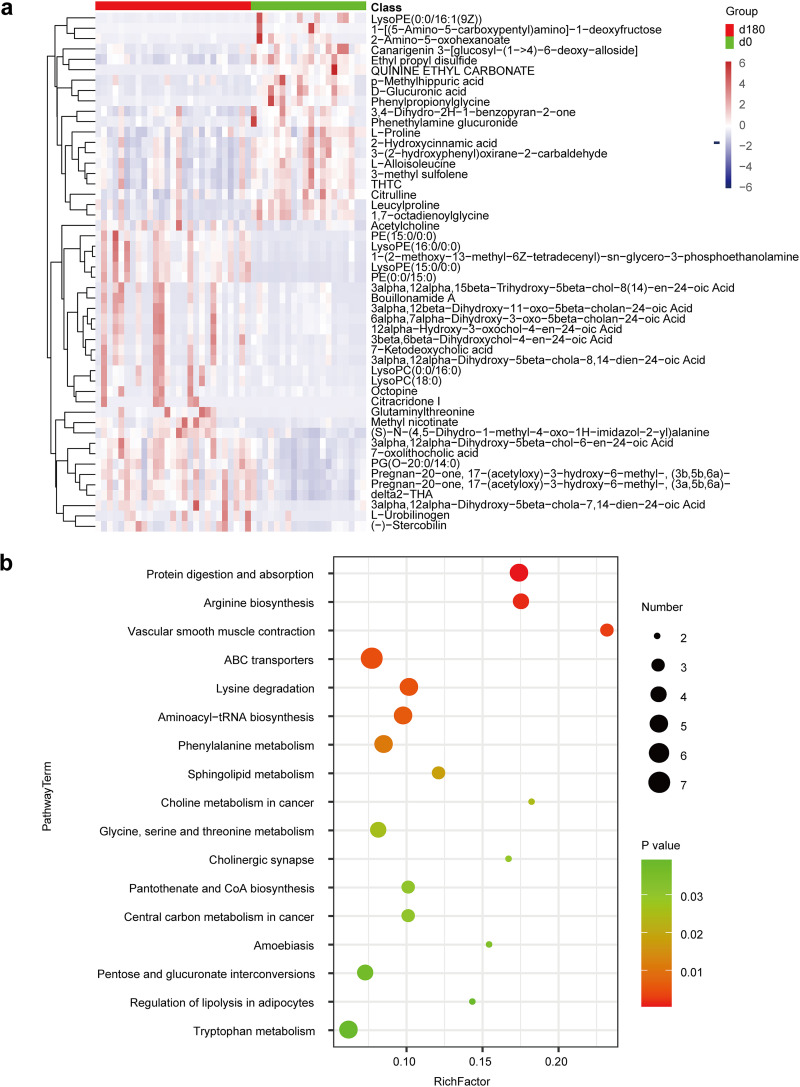
FIG 3.
Liquid chromatography-mass spectrometry analysis of fecal metabolites. (a) Heat map showing the abundances of the top 50 differential metabolites that were significantly altered between day 0 and day 180 of the voyage. (b) Bubble chart of the top 20 enriched KEGG metabolic pathways between day 0 and day 180 of the voyage. The vertical axis is the metabolic pathway; the horizontal axis is the Rich factor (the Rich factor is the number of significant differential metabolites/the total number of metabolites in the pathway). The larger the Rich factor, the greater the degree of enrichment. Coloring from green to red indicates a decrease in the P value; the larger the point, the more metabolites enriched in the pathway; LysoPEs, lysophosphatidylethanolamines; THTC, 1-tetrahydrothiophenecarboxylic acid; LysoPC, lysophosphatidylcholine; PG, phosphatidylglycerol; THA, tetracosahexaeoic acid.

