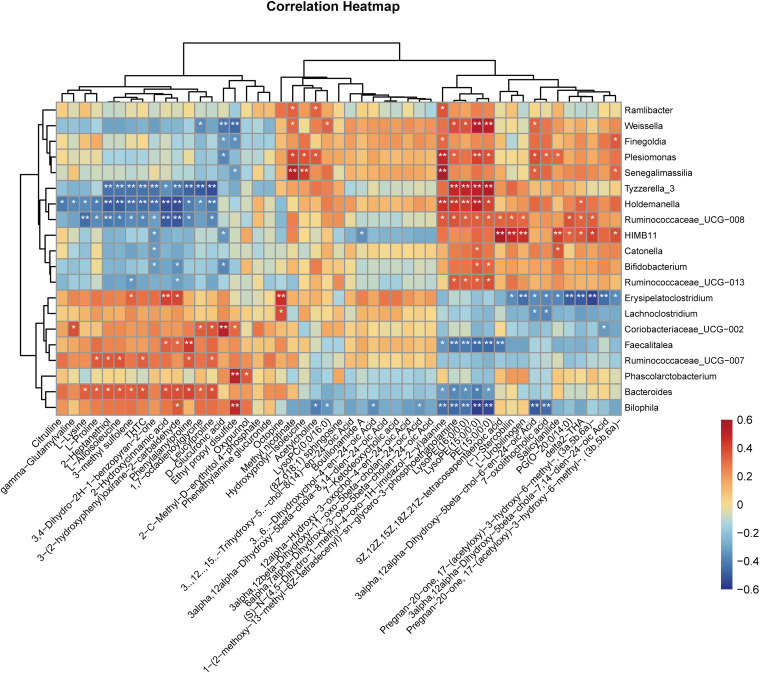
FIG 5.
Heat map visualization of the correlation analysis for the top 50 differential metabolites and the differential bacteria between day 0 and day 180 of the voyage. Spearman correlation analysis was used to examine correlations between the differential bacteria and the top 50 differential fecal metabolites according to their relative abundances.

