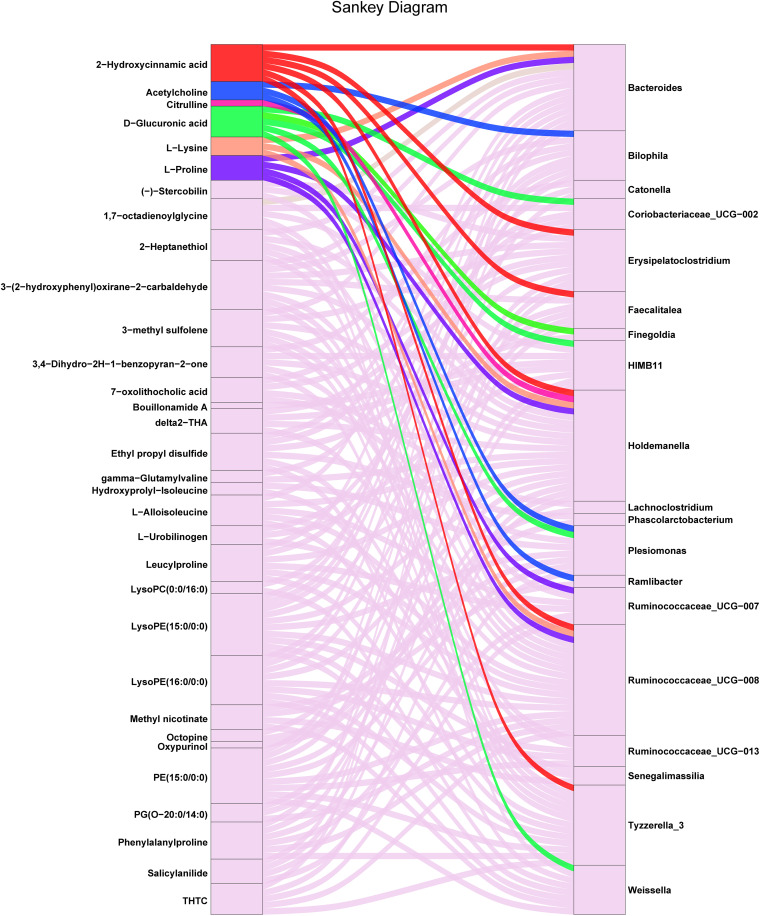
FIG 6.
Sankey diagram showing the correlations between the differential metabolites and their correlated gut microbes. The Sankey diagram was constructed based on the correlation results for the differential microbiota members-top 50 differential metabolites; a P value of <0.05 was chosen to select correlations. The six differential metabolites (in colors) annotated in human KEGG pathways were correlated with the 14 differential microbiota members. The differential metabolites in the background color were not identified in human KEGG pathways. The total rectangle size of each bacterium/metabolite represents the number of correlations between each metabolite and its correlated microbiota.

