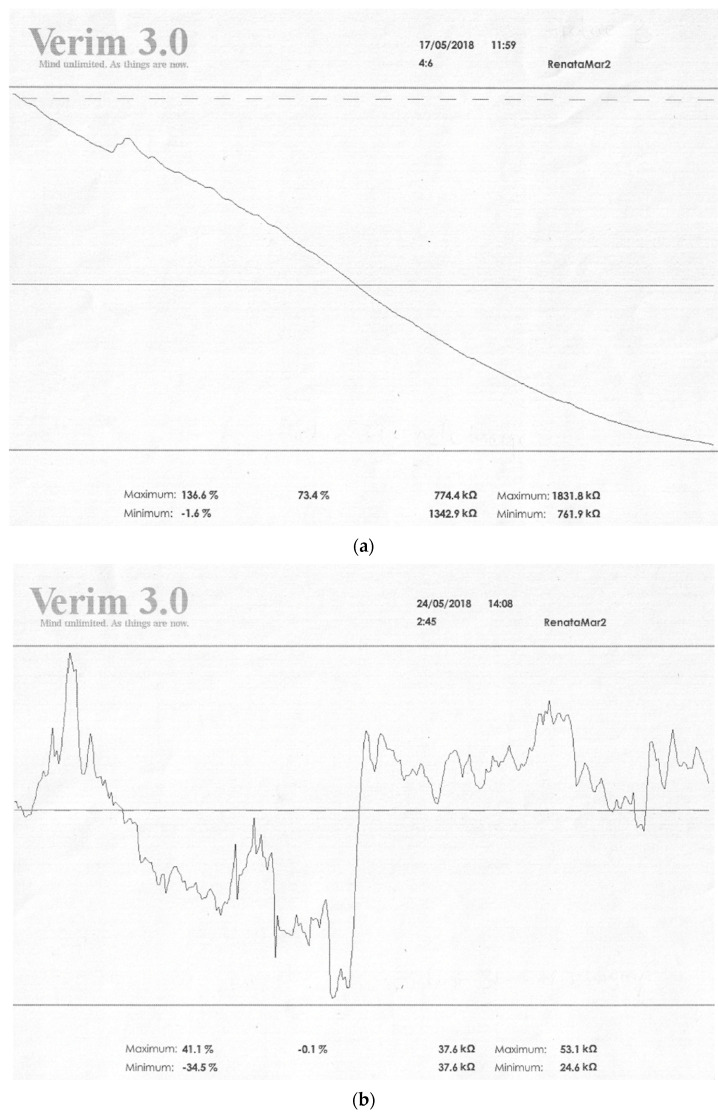
Figure 3.
(a) Figure showing the state of relaxation. (b). Figure showing the state of non-relaxation. Legend: max vs. min—values of resistance achieved by the patient in kOhm; values on the right refer to relaxation, on the left to activation. Higher values in relaxation training indicate an increase in resistance and thus an increase in relaxation; low values indicate a decrease in resistance, an increase in conductivity, and thus a decrease in relaxation. The values on the left side are the activation level. If relaxation increases, the activation of the organism decreases. Five max values vs. min are the results analogous to those presented in kOhm.

