Figure 1.

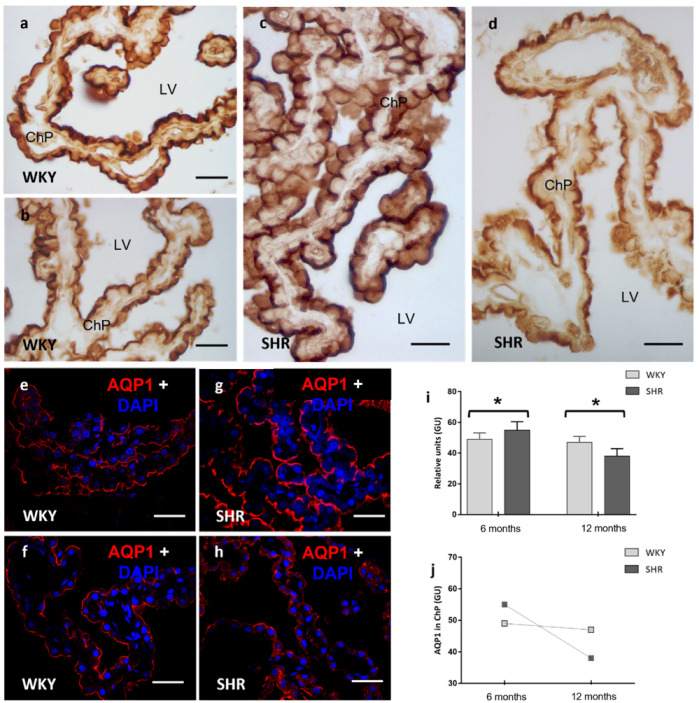
Confocal and optical microscopy images of the immunostaining of AQP1 in the ChP of WKY and SHR rats. An increase of AQP1 was observed in the ChP of SHR in the 6 months group when compared to WKY (a,c,e,g), while in the 12 months group, a decrease of AQP1 was observed in the SHR (b,d,f,h) rats. At the bottom, stain intensities values in relative units (gray units) for AQP1 (i,j) are represented as the means ± SD (n = five animals per group). The differences between WKY and SHR were significant. One-way ANOVA test with post hoc analysis using the Tukey post hoc test (* p < 0.05) was applied. LV: lateral ventricle; ChP: choroid plexus; GU: grey units. Scale bars 40 μm.
