Figure 1.
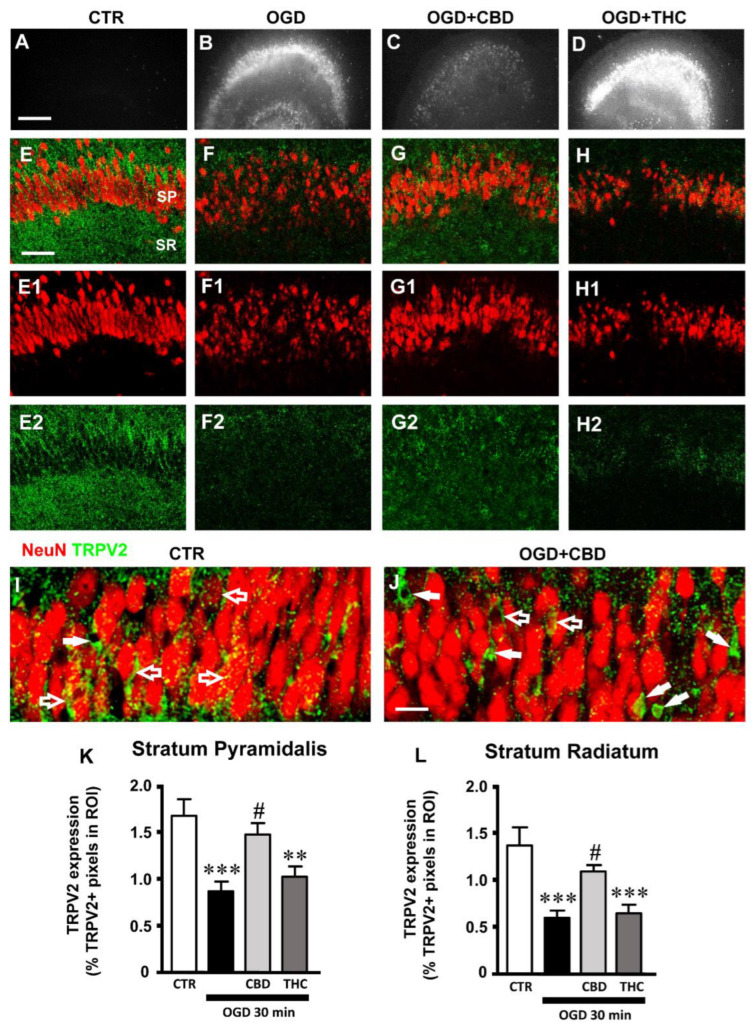
(A–D) Representative images of PI fluorescence in control (A), OGD (B), OGD + CBD, and OGD+ THC slices. Scale bar: 200 µm. (E–H2) Representative confocal images of immunostaining of neurons (NeuN, red) and TRPV2 channels (TRPV2, green) in CA1 SP and SR of CTR (E-E2), OGD (F–F2), OGD + CBD (G–G2), and OGD + THC (H–H2) slices. Images are z-projections of a single confocal z-scan captured with a 20× objective (total thickness: 1.2 µm). Scale bar: 75 µm. (I–J) Representative confocal images of immunostaining of neurons (NeuN, red) and TRPV2 channels (green) in CA1 SP of a CTR (I) and an OGD + CBD slice (J). Images are z-projections of a single confocal z-scan captured with a 40× objective (total thickness: 0.6 µm). Scale bar: 20 µm. (I) In CTR slices, the expression of TRPV2 was localized mainly on pyramidal neurons (open arrows). (J) In OGD + CBD slices, the expression of TRPV2 was localized mainly on non-neuronal cells (white arrows). (K) Quantitative analyses of TRPV2 channel expression in CA1 SP of CTR (n = 11), OGD (n = 10), OGD + CBD (n = 9), and OGD + THC slices (n = 9). Statistical analysis: one-way ANOVA p < 0.001; Newman–Keuls post hoc test *** p < 0.001 and ** p < 0.01 vs. CTR, # p < 0.05 vs. OGD. (L) Quantitative analyses of TRPV2 channel expression in CA1 SR of CTR (n = 12), OGD (n = 10), OGD + CBD (n = 8), and OGD + THC slices (n = 10). Statistical analysis: one-way ANOVA p < 0.001; Newman–Keuls post hoc test *** p < 0.001 vs. CTR, # p < 0.05 vs. OGD. Data reported in the graphs are expressed as the mean ± SEM.

