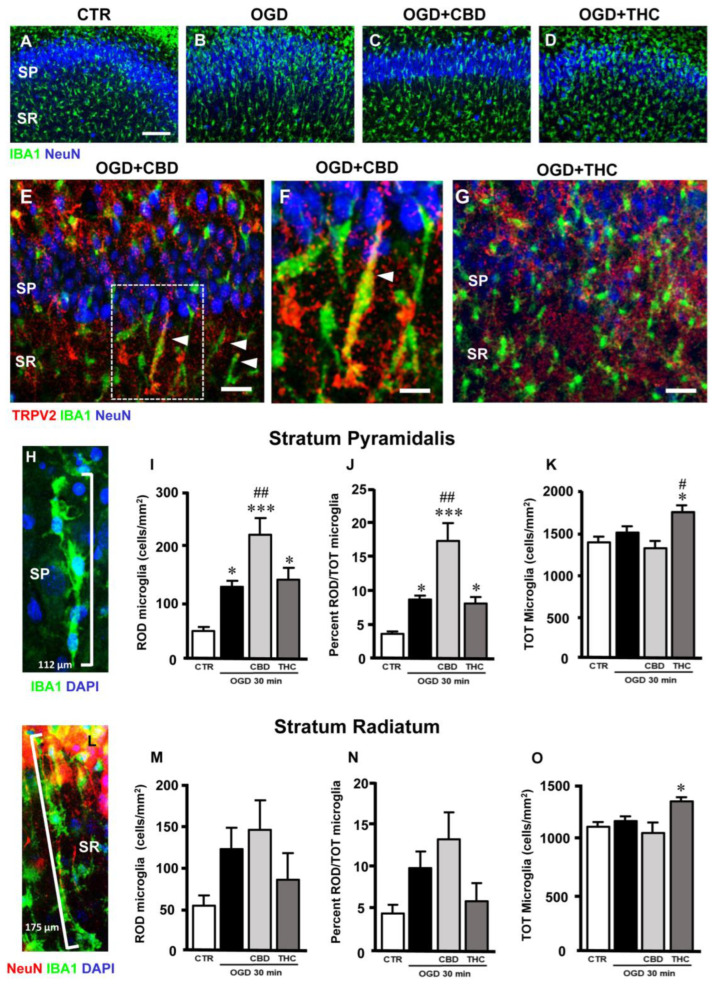
Figure 4.
(A–D) Representative confocal images of immunostaining of neurons (NeuN, blue) and total microglia (IBA1, green) in CA1 SP and SR of CTR (A), OGD (B), OGD + CBD (C), and OGD + THC (D) slices. Images are z-projections of a single confocal z-scan captured with a 20× objective (total thickness: 1.2 µm). Scale bar: 75 µm. In OGD slices, many microglia acquired a rod-like morphology, with elongated cell bodies ranging from 40 µm to over 100 µm, and with their longer axis perpendicular to CA1 SP, while other microglia acquired a round morphology typical of activated microglia. (E–G) Representative confocal images of immunostaining of TRPV2 channels (TRPV2, red), total microglia (IBA1, green), and neurons (NeuN, blue) in CA1 SP and SR of an OGD + CBD (E,F) and an OGD + THC slice (G). Images are z-projections of three confocal z-scans captured with a 40× objective (total thickness: 1.8 µm). Scale bar for panels E,G: 20 µm. Scale bar for panel F: 10 µm. In OGD + CBD slices, TRPV2 was expressed in many rod microglia (arrowheads in panel E), as better evidenced in panel F (enlargement of the framed area in panel E). Rod microglia cells are much less evident in the OGD + THC slices (panel G). (H) Representative confocal images of immunostaining of total microglia (IBA1, green) and DAPI nuclear staining (DAPI, blue) in CA1 SP of an OGD + CBD slice. Images are z-projections of 10 confocal z-scans captured with a 63× objective (total thickness: 3 µm). Four rod microglia cells (evidenced by the presence of DAPI-positive nuclei in blue) form a 112 µm-long train that stretches throughout the SP. (I) Quantitative analyses of rod microglia density in CA1 SP of CTR (n = 6), OGD (n = 8), OGD + CBD (n = 8), and OGD + THC (n = 7) slices. Statistical analysis: one-way ANOVA p < 0.0001; Newman–Keuls post hoc test *** p < 0.001 and * p < 0.05 vs. CTR, ## p < 0.01 vs. OGD. (J) Quantitative analyses of rod microglia expressed as percentage of total microglia in CA1 SP of CTR (n = 6), OGD (n = 8), OGD + CBD (n = 7), and OGD + THC (n = 7) slices. Statistical analysis: one-way ANOVA p < 0.0001; Newman–Keuls post hoc test *** p < 0.001 and * p < 0.05 vs. CTR, ## p < 0.05 vs. OGD. (K) Quantitative analyses of total microglia density in CA1 SP of CTR (n = 6), OGD (n = 8), OGD + CBD (n = 8), and OGD + THC (n = 7) slices. Statistical analysis: one-way ANOVA p < 0.01; Newman–Keuls post hoc test * p < 0.05 vs. CTR, # p < 0.05 vs. OGD. (L) Representative confocal images of immunostaining of neurons (NeuN, red), total microglia (IBA1, green), and DAPI nuclear staining (DAPI, blue) in CA1 SP of an OGD + THC slice. Images are z-projections of 10 confocal z-scans captured with a 63× objective (total thickness: 3 µm). Five rod microglia cells form a 175 µm-long train that spans from the SR into the SP. The trains are often adjacent to apical dendrites of pyramidal neurons that project into the SR (shown in red). (M) Quantitative analyses of rod microglia density in CA1 SR of CTR (n = 6), OGD (n = 5), OGD + CBD (n = 8), and OGD + THC slices (n = 5). Statistical analysis: one-way ANOVA p = 0.1549 n.s. (N) Quantitative analyses of rod microglia expressed as percentage of total microglia in CA1 SR of CTR (n = 6), OGD (n = 5), OGD + CBD (n = 8), and OGD + THC (n = 5) slices. Statistical analysis: one-way ANOVA p = 0.0682 n.s. (O) Quantitative analyses of total microglia density in CA1 SR of CTR (n = 6), OGD (n = 5), OGD + CBD (n = 8), and OGD + THC slices (n = 5). Statistical analysis: one-way ANOVA p < 0.05; Newman–Keuls post hoc test * p < 0.05 vs. CTR.

