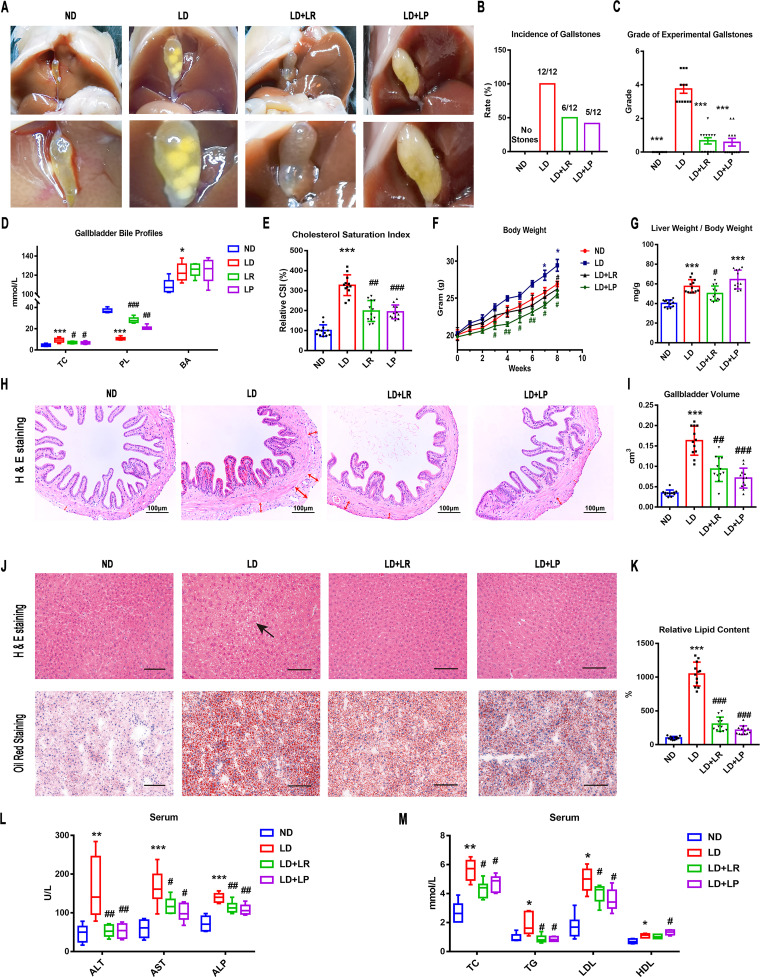
FIG 1.
L. reuteri (LR) and L. plantarum (LP) treatments reduced LD-induced gallstones and metabolic disorders in mice. Twelve mice were randomly assigned to each group and fed a normal diet (ND) or a lithogenic diet (LD) with or without L. reuteri or L. plantarum treatment (109 CFU/day) for 8 weeks. (A) Gross appearance of gallbladders and gallstones of mice administered different treatments. (B) Percentage of gallstone incidence in each group of mice. (C) The grades of experimental cholesterol gallstones (CGSs) in the mice were based on the observed cholelithiasis. (D) Total cholesterol (TC), bile acids (BA), and phospholipids (PL) in gallbladders. (E) CSI in each group of mice. (F) Body weights of mice were recorded once a week. (G) Ratios of liver weight to body weight. (H) Representative images of H&E-stained gallbladder sections (×200). The tunica adventitia of the gallbladder is indicated by red arrows. (I) Gallbladder volumes were estimated by the length, diameter, and circumference of the gallbladders. (J) Representative images of H&E-stained and oil red O-stained liver sections (×200). (K) Percentages of oil red O-positive areas. (L and M) Serum alanine aminotransferase (ALT), aspartate aminotransferase (AST), alkaline phosphatase (ALP), total cholesterol (TC), triglyceride (TG), high-density lipoprotein (HDL), and low-density lipoprotein (LDL) were determined by using a Siemens fast automatic biochemical analyzer (Advia 2400). Data were analyzed by ANOVA along with the post hoc Tukey test and are presented as the mean values ± SEM (n = 12). *, 0.01 < P ≤ 0.05; **, 0.001 < P ≤ 0.01; ***, P ≤ 0.001 versus ND group; #, 0.01 < P ≤ 0.05; ##, 0.001 < P ≤ 0.01; ###, P ≤ 0.001 versus LD group.

