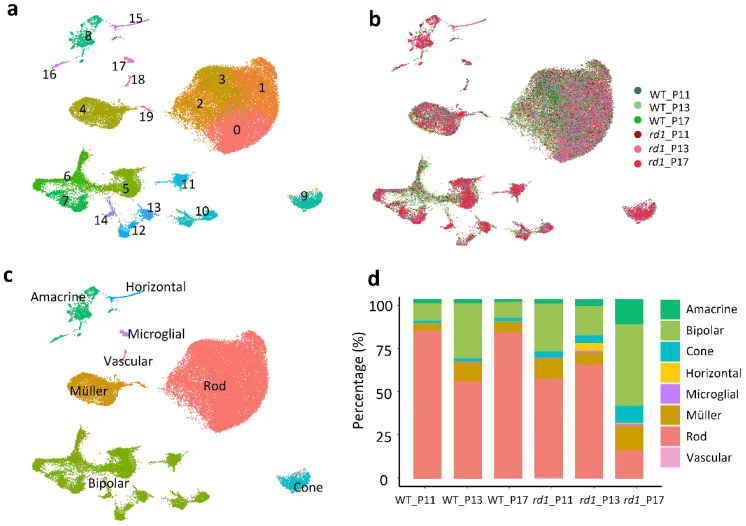
Figure 2.
Single-cell RNAseq analysis of WT vs. rd1 mouse retinas. (a) A total of 43,979 cells isolated from wild-type (WT) and retinal degeneration-1 (rd1) retinas were grouped into 20 identified clusters. (b) Distribution of all isolated cells clustered temporally. (c) All isolated cells color-coded by retinal cell type. (d) Bar graphs displaying the percentages of cell types identified in WT and rd1 samples at P11, P13, and P17. Note the marked decrease of rod photoreceptors in the rd1 P17 samples.

