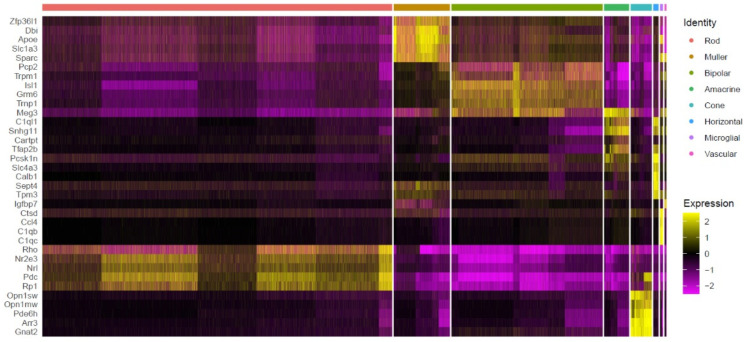
Figure 3.
Expression of 35 marker genes across eight cell types in WT and rd1 retina. The Seurat FindMaker function was used to analyze differences between cell populations and to screen each population for genes with an |avg_log2FC| > 0.58 and a p-value < 0.05 relative to all other cells. The heat map displays expression of the top 35 enriched genes across the 43,979 identified cells, pooled from all WT and rd1 retinal samples. Individual cells are grouped into the eight most abundant cell types on the x−axis, while genes are organized along the y−axis. A more yellow color indicates that a cell population highly and specifically expresses a given gene, magenta indicates low gene expression.

