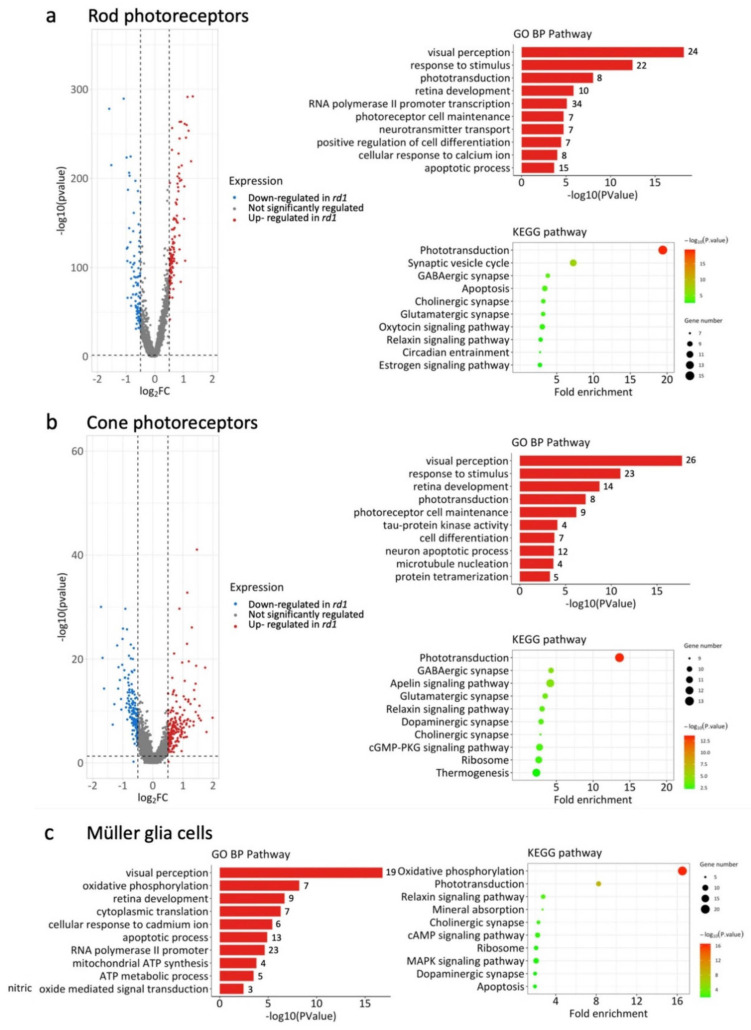
Figure 4.
Network and pathway analysis for rods, cones, and Müller glia cells. Data showing differentially enriched genes (DEGs) in rd1 retinal cell types, compared to wild-type (WT). (a) Network and pathways changes in rod photoreceptors at post-natal day (P)13, i.e., at the peak of rod degeneration. Left panel: Volcano plot of all genes significantly regulated in rd1 rods (|avg_log2FC| > 0.58). Blue dots for downregulated genes, red dots for upregulated genes, grey indicates no significant change between rd1 and WT. Top right: Gene ontology (GO) biological category (BP) analysis of DEGs showing top 10 most enriched GO BP terms. The number of DEGs for each GO term are indicated on the right. Bottom right: KEGG pathway analysis of DEGs showing top 10 enriched terms. (b) Network and pathways changes in cone photoreceptors at P17, i.e., at the start of cone degeneration. Left panel: Volcano plot of all genes significantly regulated in rd1 cones. Blue dots for down-regulated genes, red dots for upregulated genes, grey indicates no significant change between rd1 and WT. Top right: Gene ontology (GO) biological category (BP) analysis of DEGs showing top 10 most enriched GO BP terms. The number of DEGs for each GO term are indicated on the right. Bottom right: KEGG pathway analysis showing top 10 enriched terms. (c) Pathways analysis on Müller cells at P13. Left: Top 10 enriched pathways in gene ontology biological process analysis. Right: KEGG pathway analysis showing top 10 enriched terms.

