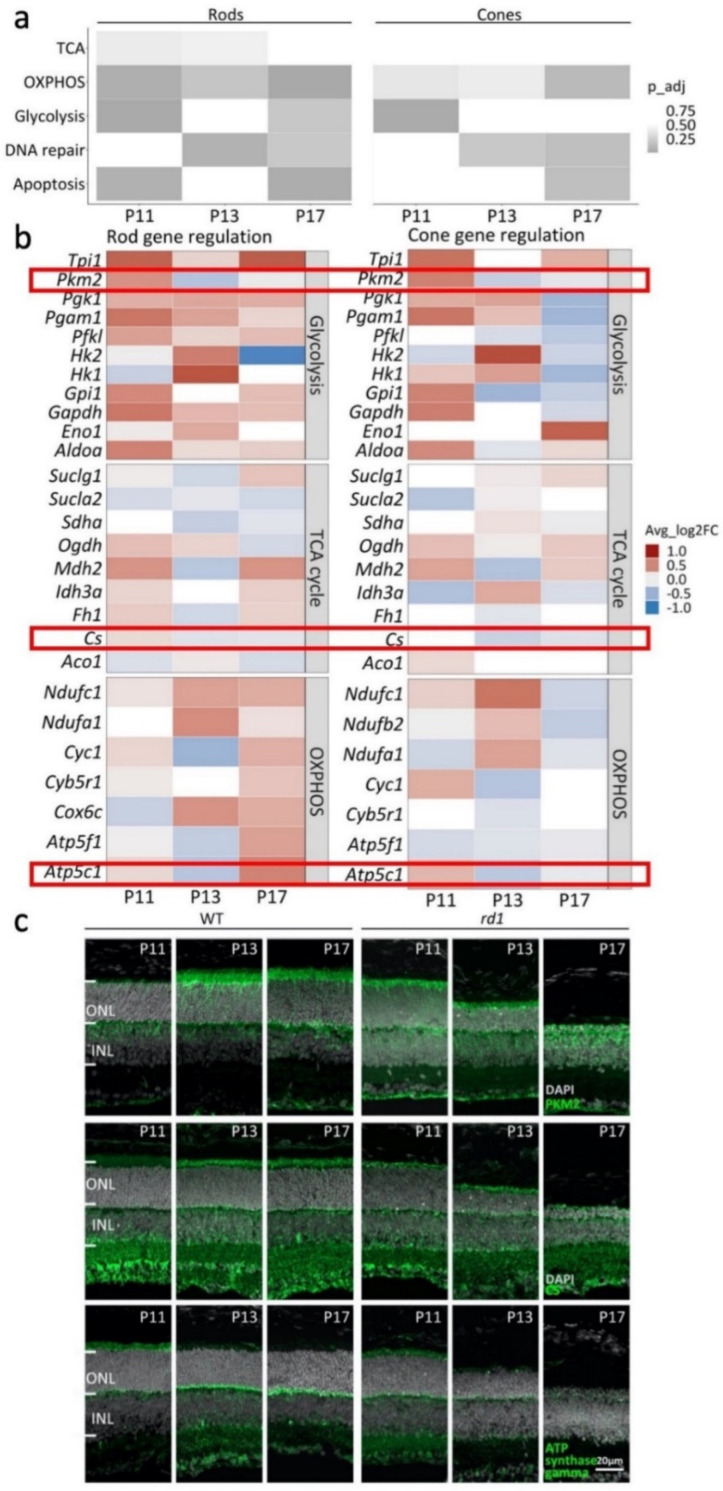
Figure 6.
Analysis of genes and enzymes of the TCA cycle, OXPHOS, and glycolysis. (a) Gene set enrichment analysis (GSEA) of differentially expressed genes (DEGs) performed on retinal degeneration−1 (rd1) vs. wild−type (WT) retina. Heatmap showing rod and cone DEGs differentially enriched from postnatal (P) day 11 to P17, in five pathways: tricarboxylic acid (TCA) cycle, oxidative phosphorylation (OXPHOS), glycolysis, DNA repair, and apoptosis. (b) Heatmap showing rd1/wt gene expression changes in individual genes involved in glycolysis, TCA cycle, and OXPHOS. Key enzymes highlighted by red frames. Gene squares filled in white when p-value > 0.5. (c) Immunofluorescence (IF) staining for citrate synthase (CS), pyruvate kinase (PKM2), and ATP synthase gamma. DAPI (grey) was employed as nuclear counterstain. ONL, outer nuclear layer; INL, inner nuclear layer.

