FIG 5.
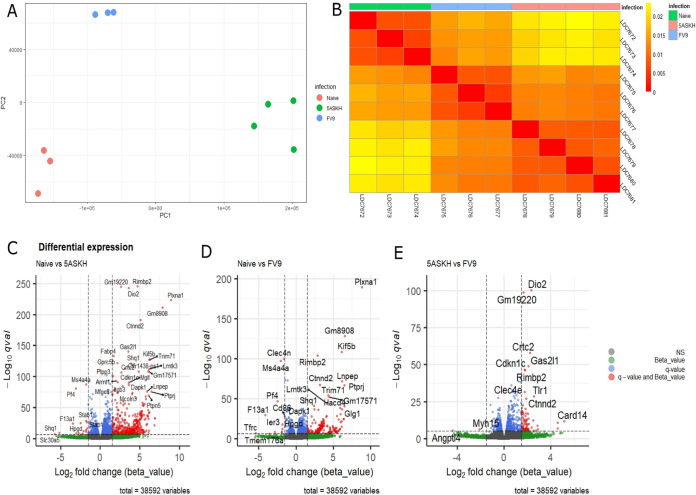
Transcriptomic profiling reveals a distinct transcripts signature of 5-ASKH or FV9 infection in BMDMs. BMDMs were cultured in vitro and infected for 5 days with 5-ASKH or FV9 (MOI, 10:1) or were left untreated. (A) Principal-component analysis (PCA) showing PC1 and PC2 for RNA-seq data. The samples are clearly clustered based on their infection status. The analysis was performed using the Sleuth R package, and the sample distance was computed using Jensen-Shannon divergence. (B) The corresponding sample heatmap. (C) A volcano plot of naive versus 5-ASKH infection showing log2 fold changes (FCs) and q value differentially expressed. The genes with log2 FC of ≥1.5 and q value of ≤10e−5 are depicted in red. (D) Naive versus FV9. (E) 5-ASKH versus FV9.

