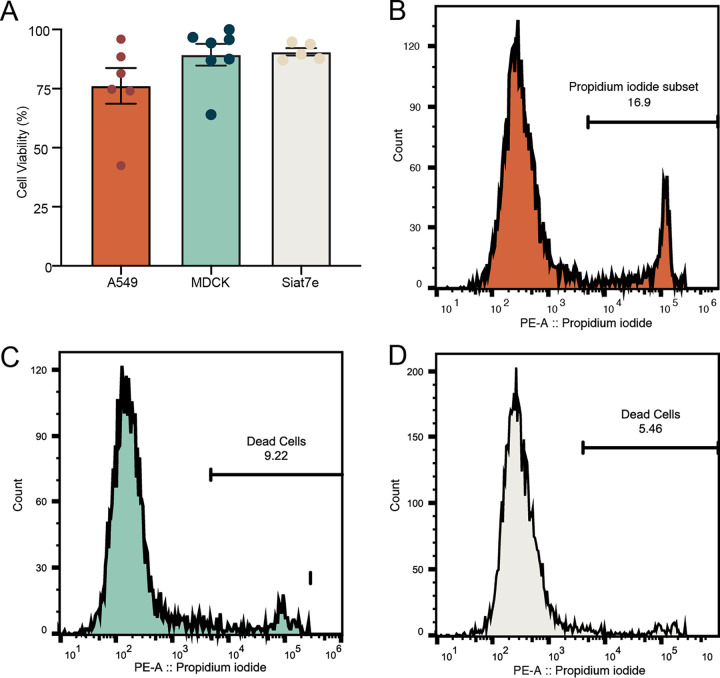
FIG 4.
Cell viability in 100-μm microfluidic drops. (A) A549, MDCK, and siat7e cell viability at 24 h postencapsulation as determined by trypan blue staining, represented by the mean ± standard error of the mean (SEM). Points represent individual experiments. (B to D) FACS analysis of cell viability for A549 (B), MDCK (C), and siat7e (D) cells. The line on the histogram indicates the gating strategy to identify apoptotic cells.

