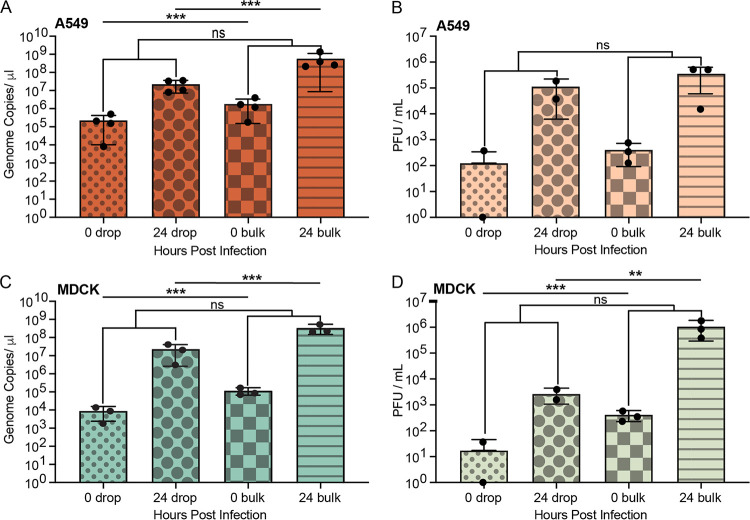
FIG 6.
Comparison of drop and bulk IAV infections in A549 and MDCK cells. (A) RNA copy number of A/California/07/2009 (H1N1) IAV in A549 cells infected at an MOI of 0.1 at 0 hpi in drops (red small dots), 24 hpi in drops (red large dots), 0 hpi in bulk (red squares), and 24 hpi in bulk (red stripe). (B) Infectious virions (PFU/mL) released from A549 cells at 0 hpi in drops (peach small dots), 24 hpi in drops (peach large dots), 0 hpi in bulk (peach squares), and 24 hpi in bulk (peach stripe). (C) RNA copy number of A/California/07/2009 (H1N1) IAV in MDCK cells infected at an MOI of 0.1 at 0 hpi in drops (aqua small dots), 24 hpi in drops (aqua large dots), 0 hpi in bulk (aqua squares), and 24 hpi in bulk (aqua stripe). (D) Infectious virions (PFU/mL) released from MDCK cells 0 hpi in drops (green small dots), 24 hpi in drops (green large dots), 0 hpi in bulk (green squares), and 24 hpi in bulk (green stripe). All data represented as mean ± the SD with a minimum of three independent experiments. Significance is based upon a two-tailed t test (**, P < 0.01; ***, P < 0.001; ns, not significant).

