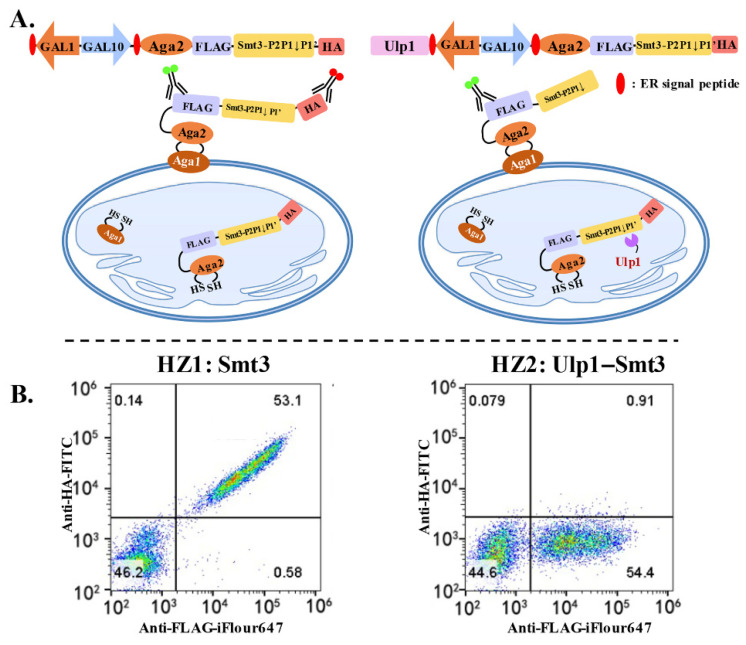
Figure 1.
YESS–PSSC system for quantitatively characterizing Ulp1–Smt3 specificity. (A) Scheme of YESS–PSSC system for substrate specificity analysis of Ulp1 against Smt3. Left: represents cells merely expressing substrate part (Aga2-FLAG-Smt3-HA). Right: represents cells simultaneously expressing Ulp1 and substrate part (Aga2-FLAG-Smt3-HA). (B) Flow cytometry analysis that characterizes Ulp1–Smt3 specificity in YESS–PSSC system. Left: HZ1 corresponded to the result of (A) left. Right: HZ2 corresponded to the result of (A) right.

