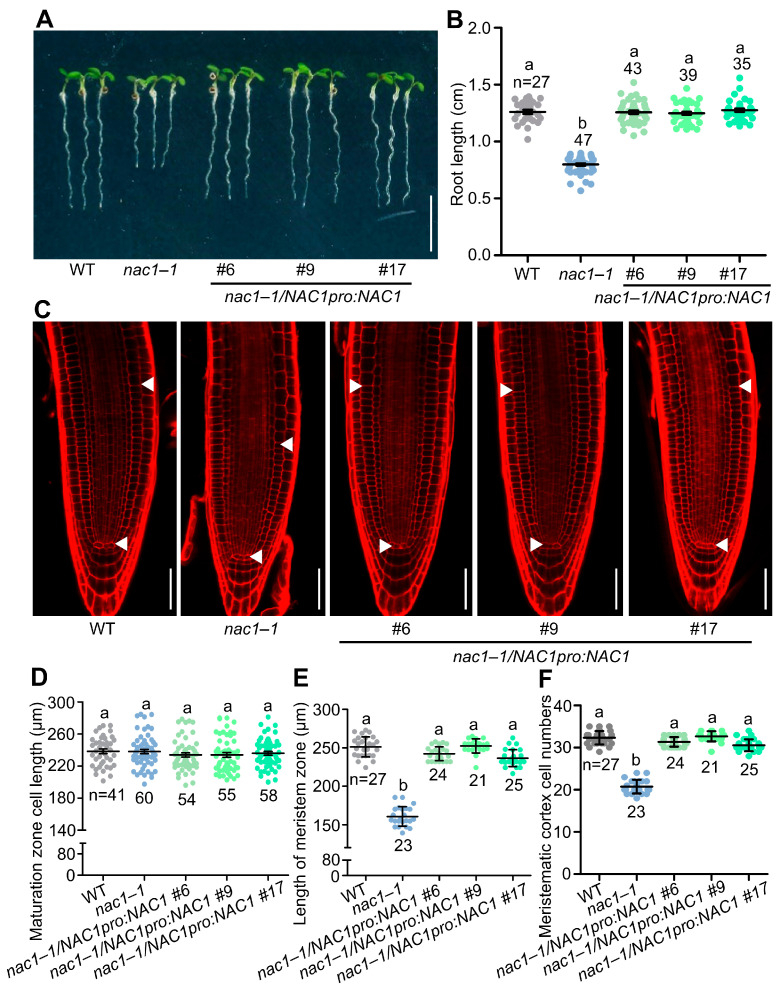
Figure 2.
NAC1pro:NAC1 rescues the short-root-length phenotype in nac1–1. (A) The root growth phenotypes of WT, nac1–1, and three biological translational transgenic lines of NAC1pro:NAC1 in nac1–1 mutant background grown on 1/2 MS medium. The seedlings were photographed at 5 dpg. Scale bar represents 0.5 cm. (B) Measurements of primary root length of WT, nac1–1, and three biological translational transgenic lines of NAC1pro:NAC1 in nac1–1 mutant background as shown in (A). (C) Confocal images of root tips of WT, nac1–1, and three biological translational transgenic lines of NAC1pro:NAC1 in nac1–1 mutant background as shown in (A). The seedlings were used at 5 dpg for imaging. White arrows indicate the boundary between root meristem and transition zones. White arrows below indicate the QC. Scale bars represent 50 μm. (D) Root cortical cell length in the maturation zone of 5 dpg seedlings as shown in (C). (E) Length of meristem zone of 5 dpg seedlings as shown in (C). (F) Cell numbers in the proliferation domain of 5 dpg seedlings as shown in (C). Data information: in (B,D–F) data represent mean ± SD, n denotes the total number of scored samples. Individual values (black dots) are shown. Different lowercase letters indicate significant differences by one-way ANOVA followed by Tukey’s multiple comparison test (p < 0.05).

