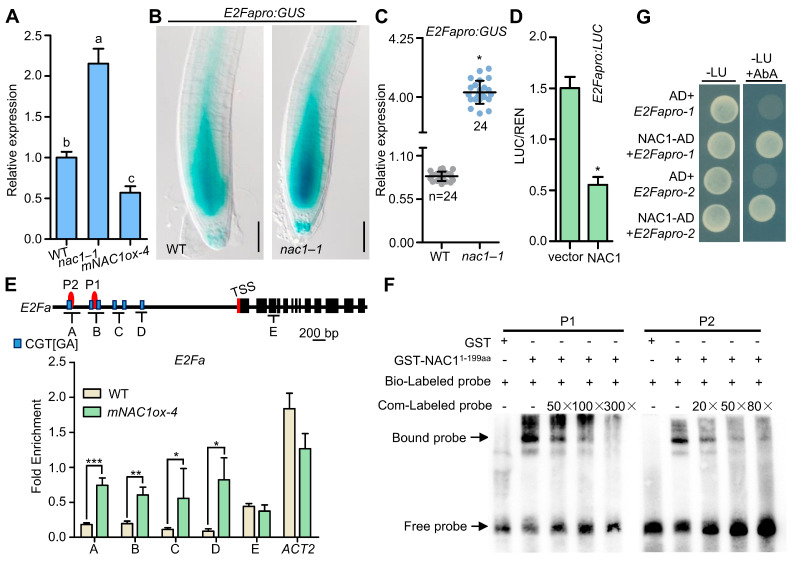
Figure 3.
NAC1 directly binds to E2Fa promoter and represses its expression. (A) RT-qPCR analysis of E2Fa expression in WT, nac1–1, and mNAC1ox-4. Total RNA was extracted from primary root of 5 dpg seedlings. The expression level in seedlings was defined as “1”. Three biological replicates with three technical replicates for each biological replicate were performed with similar results. Data represent mean ± SE of three biological replicates. Different letters above bars indicate a significant difference (one-way ANOVA, Tukey’ multiple comparisons test, p < 0.05). (B) Expression of the E2Fapro:GUS in WT, nac1–1 roots. E2Fapro:GUS crossed with nac1–1 seedling. The seedlings were photographed at 5 dpg. Scale bar represents 50 μm. (C) Statistical analysis of E2Fapro:GUS expression in (B). Data represent mean ± SD, n denotes the total number of scored samples. Individual values (black dots) are shown (Student’s t test, * p < 0.05). (D) NAC1 transrepresses the E2Fa promoter in Arabidopsis leaf protoplasts. The effector (35s::NAC1) and reporter (E2Fapro:LUC) constructs. The empty vector pBI221 was used as a negative control. Three biological replicates with three technical replicates for each biological replicate were performed with similar results. Data represent mean ± SE of three biological replicates. * means differ significantly (p < 0.05) from the negative control. (E) Schematic diagram of the E2Fa and PCR amplicons (indicated as letters A–E) used for ChIP-qPCR. TSS, transcription start site. ChIP-qPCR results show the enrichment of NAC1 on the chromatin of E2Fa. Sonicated chromatins from 5 dpg seedlings (35s::MYC-mNAC1) were precipitated with anti-Myc antibodies. The precipitated DNA was used as a template for qPCR analysis, with primers targeting different regions of the E2Fa as shown in (E). Three biological replicates with three technical replicates for each biological replicate were performed with similar results. Data represent mean ± SE of three biological replicates (*** p < 0.001, ** p < 0.01, * p < 0.05, Student’s t test). (F) Electrophoretic mobility shift assay (EMSA) shows that NAC1 (1–199aa) binds the putative motif in the E2Fa promoter. The biotin-labeled probes (P1 and P2) are indicated in (E). Unlabeled probes were used in the competition assay. (G) Yeast one-hybrid binding assay involving NAC1 and E2Fa promoters. The yeast transformants were dropped onto SD-L-U (-Leu, -Ura) media. Aureobasidin A (AbA) concentration with 290 ng/mL. E2Fapro-1 spans from −1211 to −647 bp; E2Fapro-2 spans from −646 to −1 bp.

