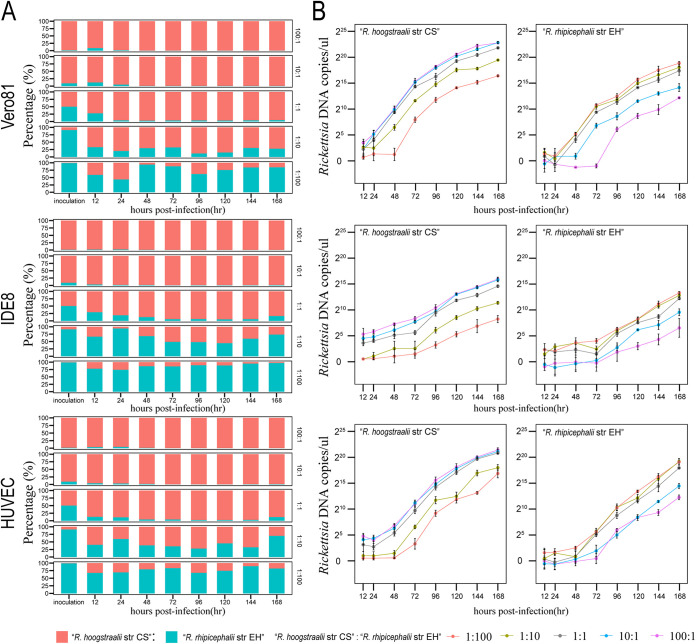
FIG 3.
Comparison of competitiveness between Rickettsia hoogstraalii str CS and Rickettsia rhipicephalii str EH when cocultured. (A) Proportions of DNA of R. hoogstraalii str CS (red) and R. rhipicephalii str EH (blue) based on quantitative PCR (qPCR) at ratios of 100:1, 10:1, 1:1, 1:10, and 1:100 R. hoogstraalii str CS:R. rhipicephalii str EH (N = 3 per group). (B) Growth curve based on qPCR at ratios of 1:100 (red), 1:10 (dark yellow), 1:1 (gray), 10:1 (blue), and 100:1 (violet) R. hoogstraalii str CS:R. rhipicephalii str EH (N = 3 per group). Error bars represent the standard deviation of the mean.

