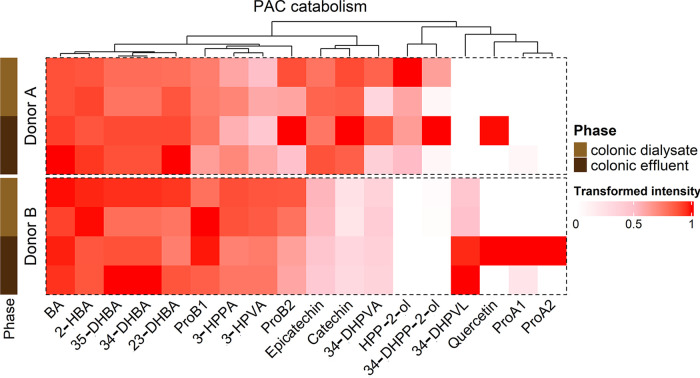
FIG 2.
Hierarchical profiling of PAC catabolism between donors in gut effluents and dialysates after a 14-day treatment. Heatmap displaying the transformed intensity of the PAC catabolites remaining in gut effluents and dialysates after 14 days of PAC-rich extract treatment and following a 2-h UPEC exposure, as determined by UPLC-QToF in negative ionization. BA = Benzoic Acid; 3-HPVA = 5-(3′-hydroxyphenyl)valeric acid; 35-DHBA = 3,5-dihydroxybenzoic acid; ProA2 = Procyanidin A2; ProB2 = Procyanidin B2; HPP-2-ol = 1-(Hydroxyphenyl)-(2′,4′,6′-trihydroxyphenyl)-propan-2-ol; 2-HBA = 2-hydroxybenzoic acid; 3-HPPA = 3-(3′-hydroxyphenyl)propanoic acid;, 4-DHPVA = 5-(3′,4′-dihydroxyphenyl)valeric acid; ProA1 = Procyanidin A1; 34-DHPP-2-ol = 1-(Dihydroxyphenyl)-3-(2′,4′,6′-trihydroxyphenyl)-propan-2-ol; ProB1 = Procyanidin B1; 34-DHPVL = 5-(3′,4′-dihydroxyphenyl)-γ-valerolactone; 34-DHBA = 3,4-dihydroxybenzoic acid; 4_HPAA = 2-(4′-hydroxyphenyl)acetic acid; 34-DHPPA = 3-(3′,4′-dihydroxyphenyl)propanoic acid; 4-HPPA = 3-(4′-hydroxyphenyl)propanoic acid.

