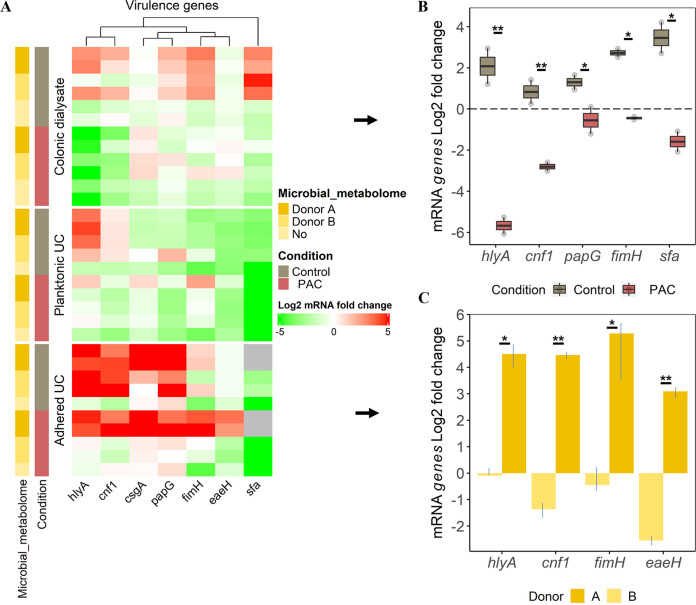
FIG 5.
Profiling of UPEC main virulence genes expression from the gut reservoir to urothelium. (A) Heatmap displaying the log2 fold change UPEC virulence genes expression according to the ecosystem exposure (colonic dialysate, planktonic and adhered bacteria to UC), the microbial metabolome origin and the treatment. Induction (log2 fold change expression ≥ 1) is denoted in shade of red, and repression (≤ -1) in shade of green, as determined by RT-qPCR. Samples with failed amplification are displayed in gray. (B) Selection of genes from dialysis cassettes remaining significantly different between control and PAC conditions are indicated with P ≤ 0.05 (*) or P ≤ 0.01 (**), as determined by the Friedman post hoc Wilcoxon test. (C) Selection of genes from adhered UPEC treated with PAC that are significantly different between donors A and B, as determined by the Friedman post hoc Wilcoxon test.

