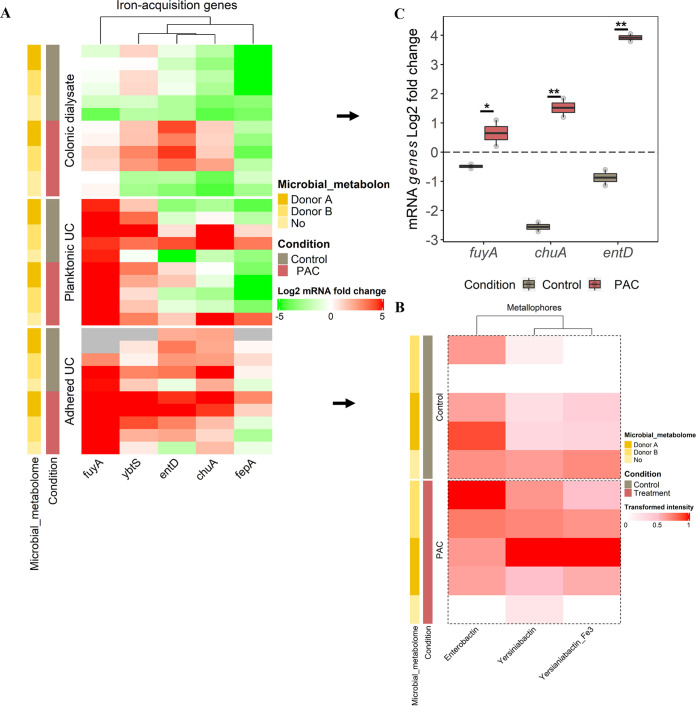
FIG 6.
Profiling of UPEC iron-acquisition genes expression from the gut reservoir to urothelium. (A) Heatmap displaying the log2 fold change UPEC iron-acquisition genes expression according to the ecosystem exposure (colonic dialysate, planktonic and adhered bacteria to UC), the microbial metabolome origin and the treatment. Induction (log2 fold change expression ≥ 1) is denoted in shade of red and repression (≤ -1) in shade of green, as determined by RT-qPCR. Samples with failed amplification are displayed in gray. (B) Heatmap displaying the transformed intensity of the metallophores metabolites remaining in UC medium after 6 h of UPEC infection, as determined by Reverse-Phase Liquid Chromatography (RPLC) positive. (C) Selection of genes from dialysis cassettes remaining significantly different between control and PAC conditions are indicated with P ≤ 0.05 (*) or P ≤ 0.01 (**), as determined by the Friedman post hoc Wilcoxon test.

