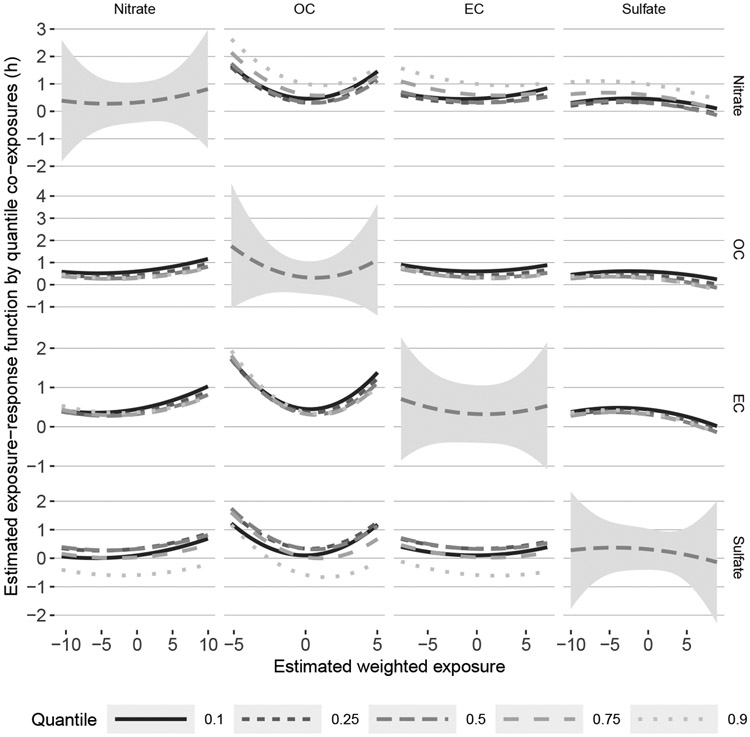
Fig 4:
Cross sections of the estimated exposure-response function () from BKMR-DLM with a quadratic kernel. The panels on the diagonal show the main effect, which is the association between a weighted exposure (x-axis) and the outcome at the median level of all other weighted exposures. The dashed line represents the posterior mean and the shaded ribbon represents the 0.95 credible interval. The off-diagonals show the exposure-response function at different quantiles of a single co-exposure. For example, the top right panel shows the sulfate exposure-response relationship at different quantiles of nitrate and median levels of OC and EC. A fanning or deviation from parallel lines in the exposure-response relationship represents evidence of an interaction.

