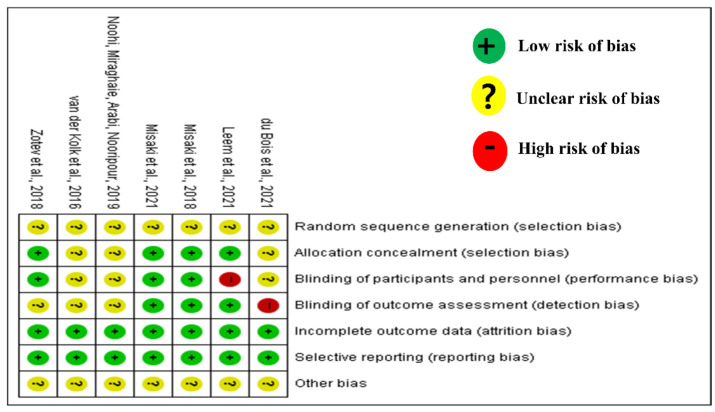
Figure 10.
Summary of Cochran risk of bias in RCTs. Green indicates low risk of bias, yellow indicates unclear bias, and red indicates high bias risk. Misaki et al (2018) [26]; Misaki et al (2021) [27]; Zotev et al (2018) [28]; vander Kolket et al (2016) [29] du Bois et al (2021) [30]; Leem et al (2021) [31].

