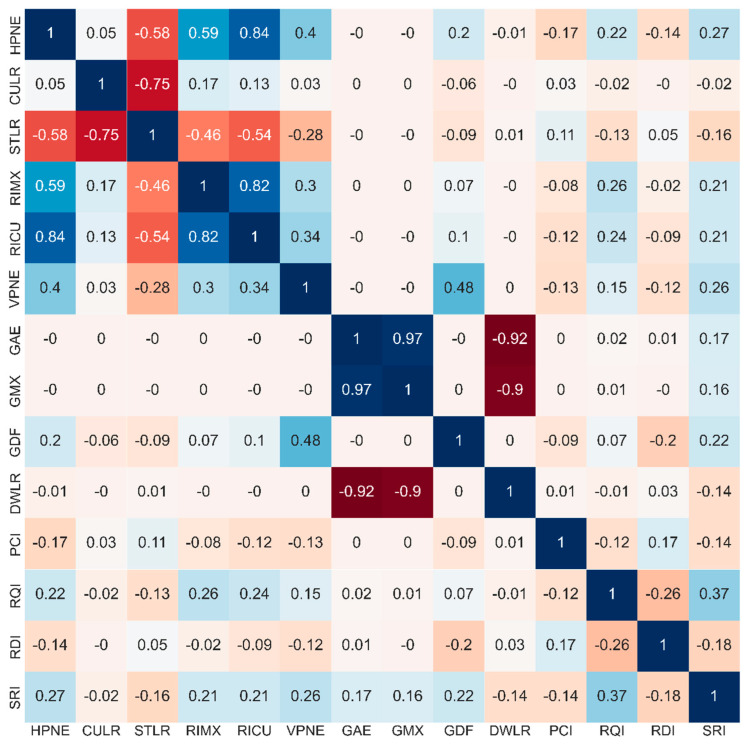
Figure 4.
Pearson correlation matrix of continuous feature variables. If the correlation coefficient is greater than 0, it is a positive correlation, and if it is less than 0, it is a negative correlation. The stronger the correlation, the darker the color. The stronger the positive correlation, the closer to blue; the stronger the negative correlation, the closer to red.

