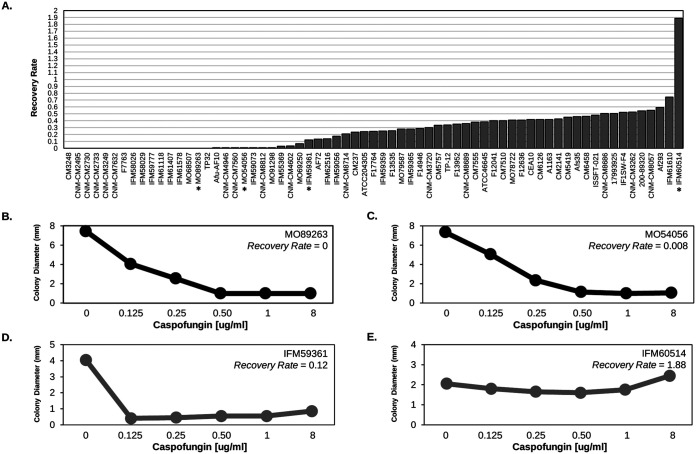
FIG 1.
Quantification of CPE across A. fumigatus isolates. (A) CPE, as measured by the recovery rate (y axis), was calculated across the 67 A. fumigatus isolates (x axis). We considered isolates displaying a recovery rate of ≥0.1 as possessing the CPE. An asterisk (*) under the isolate identifier represents isolates in panels B to D. (B to E) Examples of isolates lacking (B and C) and possessing (D and E) the CPE phenotype. The average colony diameter (y axis) is plotted for caspofungin concentrations of 0, 0.125, 0.25, 0.5, 1, and 8 μg/mL (x axis).

