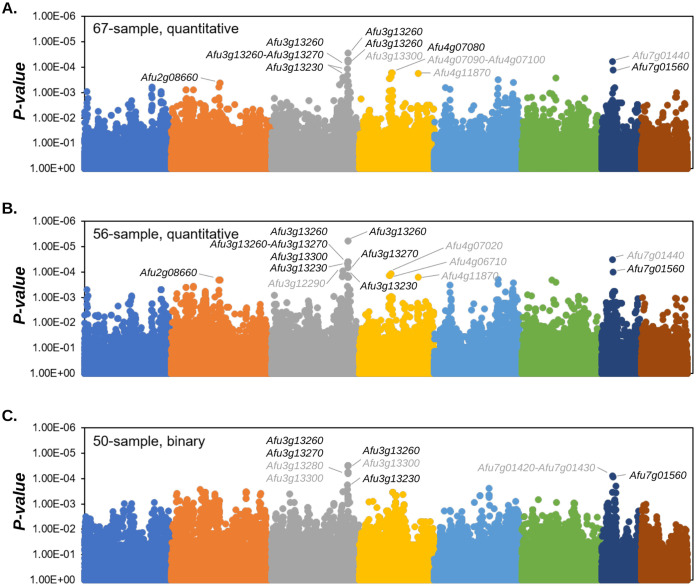
FIG 3.
Genomewide association for CPE. Manhattan plots for the 67-sample (A), 56-sample (B), and 50-sample (C) GWAs are shown. Genes overlapping the lowest 25 P values for each GWA are labeled. Gene labels in black represent genes that were experimentally knocked out. Colors represent chromosomes 1 to 8.

