FIG 2.

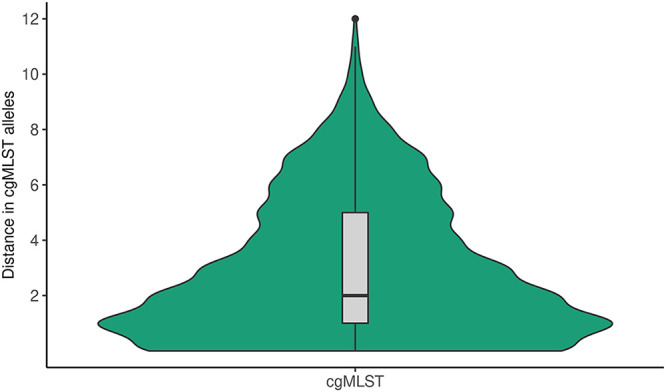
Violin plot of the distance in cgMLST alleles between isolates within the same cgMLST cluster (n = 313). This includes 313 isolates that were linked to at least one other isolate based on a distance of ≤5 alleles.

Violin plot of the distance in cgMLST alleles between isolates within the same cgMLST cluster (n = 313). This includes 313 isolates that were linked to at least one other isolate based on a distance of ≤5 alleles.