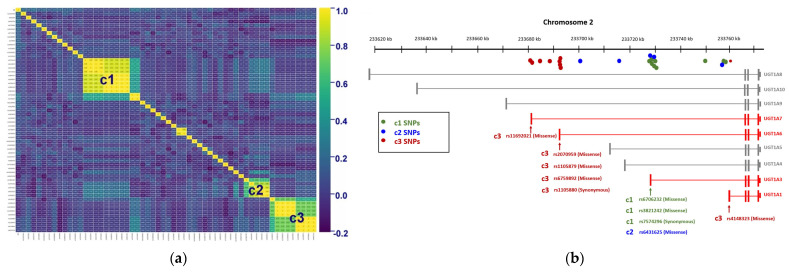
Figure 2.
(a) Correlation matrix of 57 significant SNPs (p < 0.05). There are three clusters (c1, c2, and c3) of SNPs that are highly correlated with each other (r > 0.6). All clusters are located in the UGT1A region. (b) The graph shows the distribution of SNPs in the UGT1A region. The three clusters in the correlation matrix are represented by green (c1), blue (c2), and red (c3). Most c1 and c2 SNPs are clustered near the first exon of UGT1A3, and three of them belong to missense variants. Except for rs4148323, which is the missense variant of UGT1A1, the other c3 SNPs are concentrated between the first exon of UGT1A7 and the first exon of UGT1A6, and most of them are missense variants of UGT1A7 or UGT1A6.

