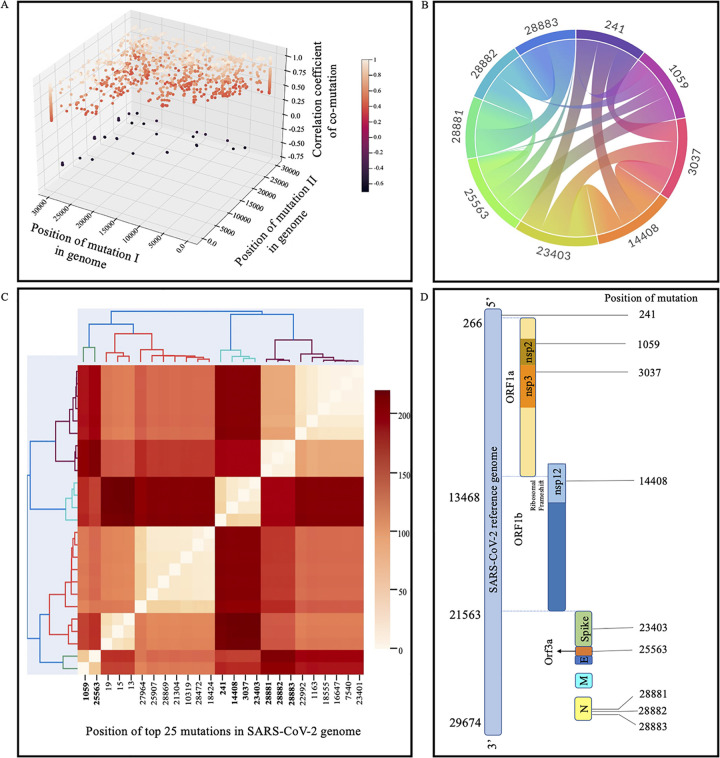
FIG 4.
Significant mutations that were correlated and clustered with each other by using statistical approaches (Pearson correlation and hierarchical clustering). (A) Three-dimensional plot showing the comutations having Pearson correlation coefficients with absolute values of >0.4. The degree of correlation is reflected by the color. The correlation coefficient ranges from −1 to +1; absolute values closer to 1 have a higher correlation than those closer to 0. (B) Chord plot representing comutations with absolute correlation coefficients of >0.4 and occurring in more than 30% of the genomes used in the study. (C) Hierarchical clustering of the 25 most significant mutations obtained from ViPR having a frequency of >10%. The x axis represents the significant mutations. The colors represent the distances among the mutations. The comutations identified in this study are highlighted in bold. (D) Cartoon showing the positions of mutations in the viral genome.

